A Beginner’s Guide to Google Analytics 4 Metrics and Setup


Google Analytics 4 (GA4) is the latest generation of Google’s analytics platform, designed for a world where users constantly switch between devices, apps, and websites. Unlike its predecessor, Universal Analytics (UA), which mainly tracked pageviews and sessions, GA4 uses an event-based tracking model. This model captures every interaction—like clicks, scrolls, form submissions, video plays, and even user engagement across different platforms—without requiring extra tracking codes or complicated setups.
What sets GA4 apart is its focus on a user-centric, privacy-first approach. While UA provided a snapshot of what users did during a single session, GA4 offers a comprehensive view of the entire customer journey across devices. It also integrates machine learning-powered insights, predictive metrics, and enhanced reporting, helping businesses make smarter, data-driven decisions. Simply put, GA4 is not just an upgrade—it’s a complete reimagining of how we understand user behavior in a digital-first world.
GA4 vs. Universal Analytics: What’s the Difference?
Now, let’s break down the key differences between GA4 and Universal Analytics so you know exactly what sets GA4 apart—and why it’s such a game-changer in the world of digital analytics.
Imagine you’re running a store, both online and in a physical space. In the old days, Universal Analytics was like a basic security camera at the entrance. It could tell you how many people walked through the door, how many times they came back, and maybe where they came from. But it didn’t show you what people actually did inside—whether they stopped to browse a specific shelf, checked out the sale rack, or walked straight to the cash counter. Your understanding of customer behavior was limited to surface-level insights. That’s where GA4 comes in and flips the game on its head.
GA4 isn’t just a camera at the entrance; it’s like having smart sensors throughout your store, tracking how customers interact with every product and touchpoint—without invading their privacy. It tells you if they clicked a product, added it to their cart, signed up for your newsletter, watched a video, or even scrolled to the bottom of the page. It’s a comprehensive, event-based model that captures the entire user journey, not just isolated snapshots of traffic.
Let’s explore these differences side by side:
| Feature | Universal Analytics (UA) | Google Analytics 4 (GA4) |
| Data Model | Session-based (focus on sessions & pageviews) | Event-based (every interaction is an event) |
| Cross-Platform Tracking | Limited; website & app data tracked separately | Unified tracking for websites and apps |
| User-Centric Approach | Relies heavily on cookies & session IDs | Uses event & user IDs for a holistic view across devices |
| Event Tracking | Manual setup with Category, Action, Label | Pre-built events; fully customizable without code changes |
| Privacy & Compliance | Less flexible for GDPR/CCPA compliance | Built-in privacy controls (Consent Mode, Data Deletion, etc.) |
| Machine Learning | Limited predictive features | Predictive analytics & automated insights included |
| Reporting | Predefined reports; limited customization | Customizable reports via Explorations & Analysis Hub |
| Future-Proofing | Dependent on cookies; deprecated by July 2024 | Cookie-light, designed for a cookieless future |
In Universal Analytics, sessions were the backbone of everything. Every visit to your website was tracked as a session, and metrics like bounce rate, time on site, and pages per session were standard indicators of performance. But this approach had limitations. It treated user interactions in isolation, which made it hard to see the full picture of user behavior—especially when users interacted across multiple devices or channels.
GA4, on the other hand, throws the old playbook out the window. It treats everything as an event—a pageview, a click, a video play, a form submission, even a purchase. This means you’re not just counting visits; you’re capturing every meaningful interaction, giving you a much more granular and dynamic understanding of how users engage with your brand.
For example, in UA, if a user visited your site, watched a video, clicked a product, and then left, you’d mainly know they were part of one session. In GA4, you can see exactly what they did: the video play, the button click, the scroll depth, and even whether they came back later on a different device. That’s the power of an event-based model—it turns fragmented data into a cohesive story.
Another game-changing feature is GA4’s cross-platform tracking. If you have a website and an app, you can finally view all your user data in one unified report. This wasn’t possible in UA, where website and app data were siloed, often requiring complicated setups or multiple properties. Now, you can see a customer’s entire journey—whether they discover you on their phone, sign up on the web, or purchase from your app—all in one place.
Privacy is also a huge differentiator. GA4 is built for a future where cookies are fading away and data privacy regulations are only getting stricter. With built-in tools like Consent Mode, data deletion requests, and advanced user controls, GA4 helps you stay compliant with laws like GDPR and CCPA without sacrificing insights.
Lastly, GA4 offers something UA never could: predictive analytics. By using machine learning, GA4 can surface trends, identify anomalies, and even forecast outcomes—like predicting which users are most likely to make a purchase. It’s like having an AI-powered analyst working alongside you, making sense of complex data patterns you might otherwise miss.
In a nutshell, Universal Analytics was great for its time, but it’s no longer enough. The digital world has evolved, and so must our tools. GA4 is the next-generation solution that’s not just an upgrade—it’s a complete reimagining of how we understand and act on user behavior in a multi-platform, privacy-first world.
How to Set Up Google Analytics 4
Setting up Google Analytics 4 might seem a bit intimidating at first, but once you understand the steps, it’s actually pretty straightforward. Let’s break it down so you can hit the ground running!
First, if you’re completely new to Google Analytics, you’ll start fresh by creating a new GA4 property. But if you already have a Universal Analytics (UA) property, you’ll need to set up a GA4 property alongside your existing setup. This allows you to keep your historical UA data while starting to collect new data in GA4.
Here’s how to get started:
Step 1: Sign in to Google Analytics
Go to Google Analytics and sign in with your Google account. If you don’t have an account yet, you’ll need to create one.
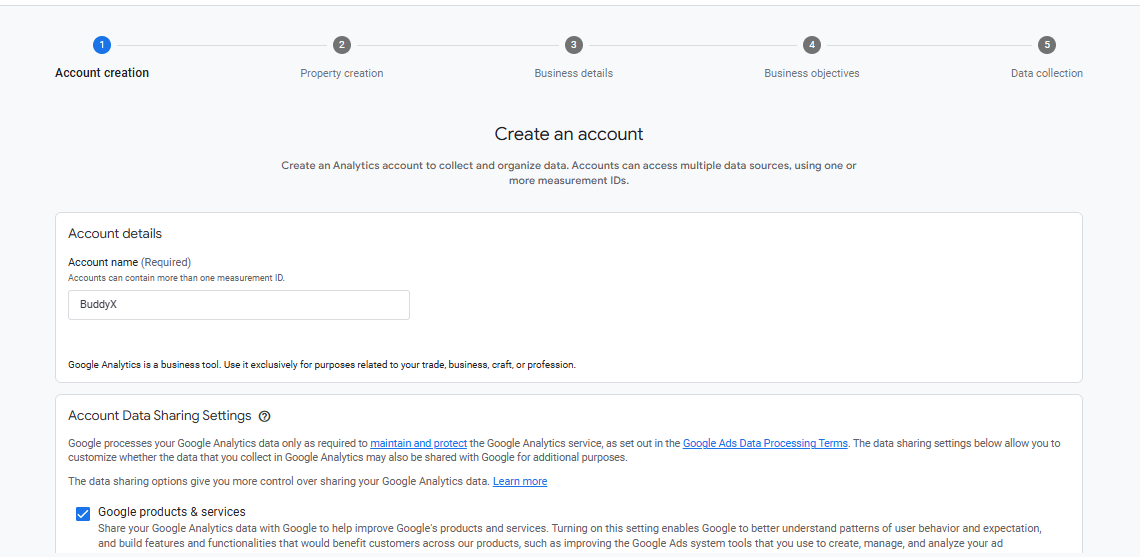
Step 2: Create a GA4 Property
In your Analytics account, click on the Admin gear at the bottom-left corner. Under the Account column, choose the account where you want the GA4 property. Then, under the Property column, click Create Property.
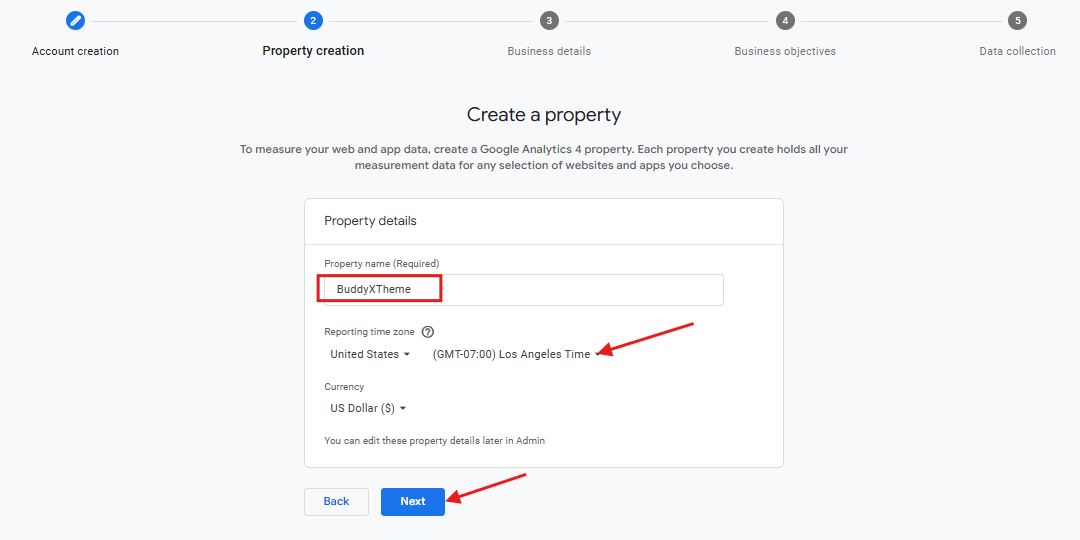
Enter a name for your property (like “My Website GA4”), select your time zone and currency, and click Next.
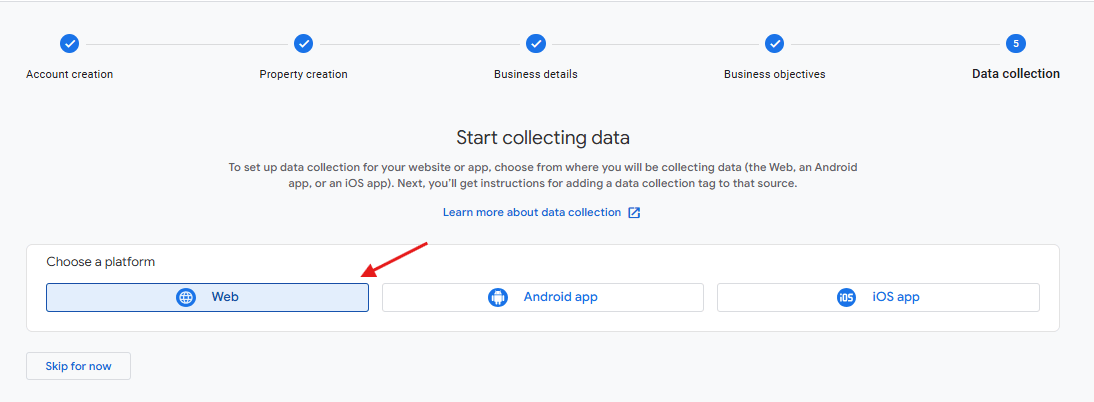
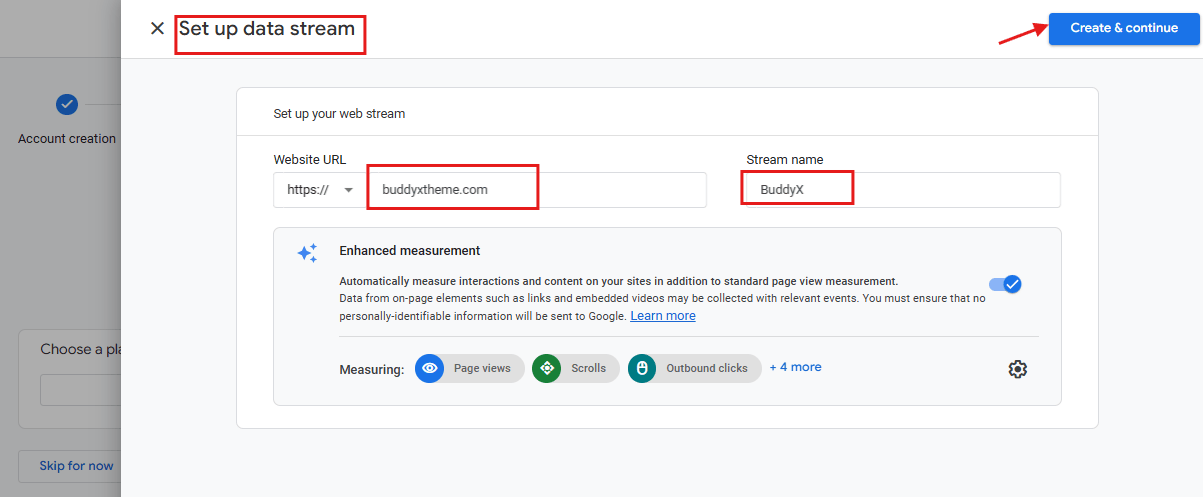
Step 3: Set Up Data Streams
After creating your property, you’ll be prompted to set up a data stream. A data stream is how GA4 collects data from your website or app.
-
Click Web for your website, then enter your site’s URL and a name for the stream. Toggle on the Enhanced Measurement option—this allows GA4 to automatically track common events like scrolls, outbound clicks, and video engagement.
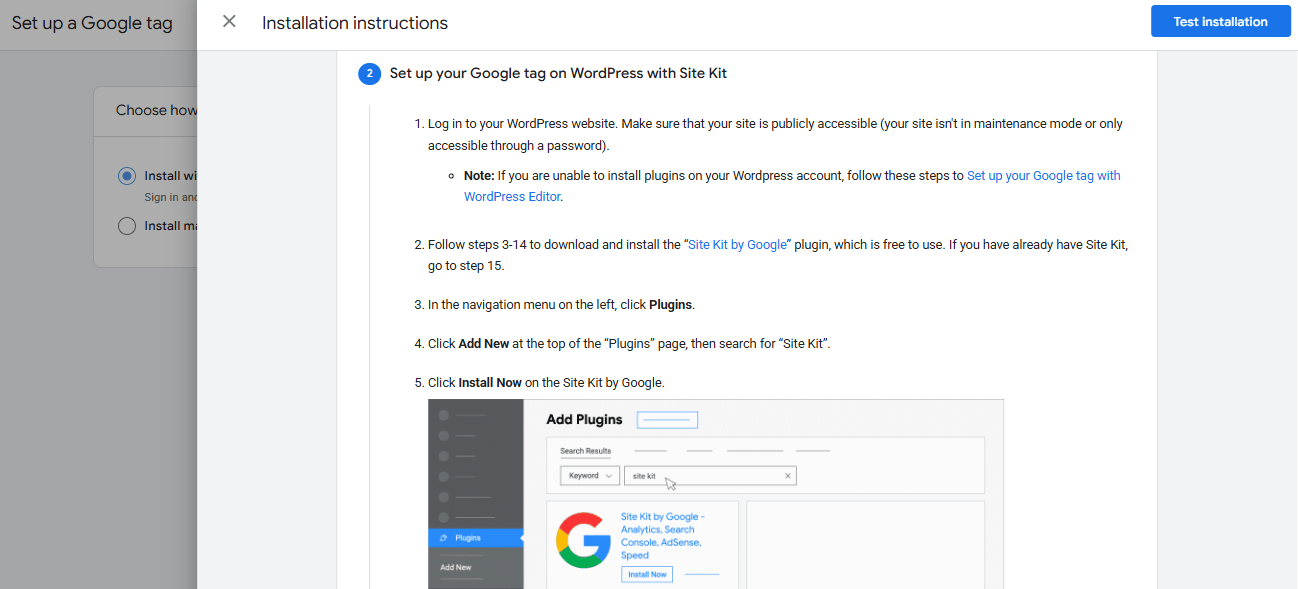
Step 4: Install the GA4 Tracking Code
After setting up your data stream, you’ll get a Measurement ID (it looks like G-XXXXXXXXXX). Copy this ID.
![]()
Go to your website’s backend or use tools like Google Tag Manager to add the GA4 code snippet to your site’s header. If you’re using WordPress, you can use a plugin like Site Kit by Google to make this step super easy.
Step 5: Verify Data Collection
Once your GA4 code is installed, visit your website and check the Realtime reports in GA4. You should start seeing data flow in. This confirms that everything’s working as expected.
Step 6: Set Up Conversions and Events
Finally, you’ll want to configure conversions (like form submissions or purchases) and custom events that matter most to your business. GA4 lets you mark any tracked event as a conversion in a few clicks—go to Configure > Events, find your event, and toggle it as a conversion.
That’s it! You’ve now set up Google Analytics 4 and are ready to explore its powerful metrics and insights. Remember, GA4 is designed to adapt as your data needs grow, so take your time exploring the interface, understanding the reports, and customizing the setup for your goals.
Understanding Users: The Foundation of Your Data
In Google Analytics 4 (GA4), Users represent the unique individuals interacting with your website or app. Understanding user metrics isn’t just helpful — it’s essential. It’s the bedrock for measuring your brand’s digital reach and effectiveness, providing a clear picture of how many people engage with your content, how often they return, and how their behavior evolves over time. The more you understand your users, the better you can tailor your content, optimize your website, and improve your marketing strategy.
Key User Metrics:
Total Users
The total number of unique individuals who engaged with your site or app within a selected time frame. This is the broadest measure of audience size and growth. It helps you gauge the reach of your marketing efforts and see how many people your brand is attracting over time.
New Users
The count of first-time users during the period. Monitoring new users sheds light on the success of marketing campaigns and user acquisition efforts. It tells you whether your brand is expanding its footprint or whether your traffic is mostly from returning visitors.
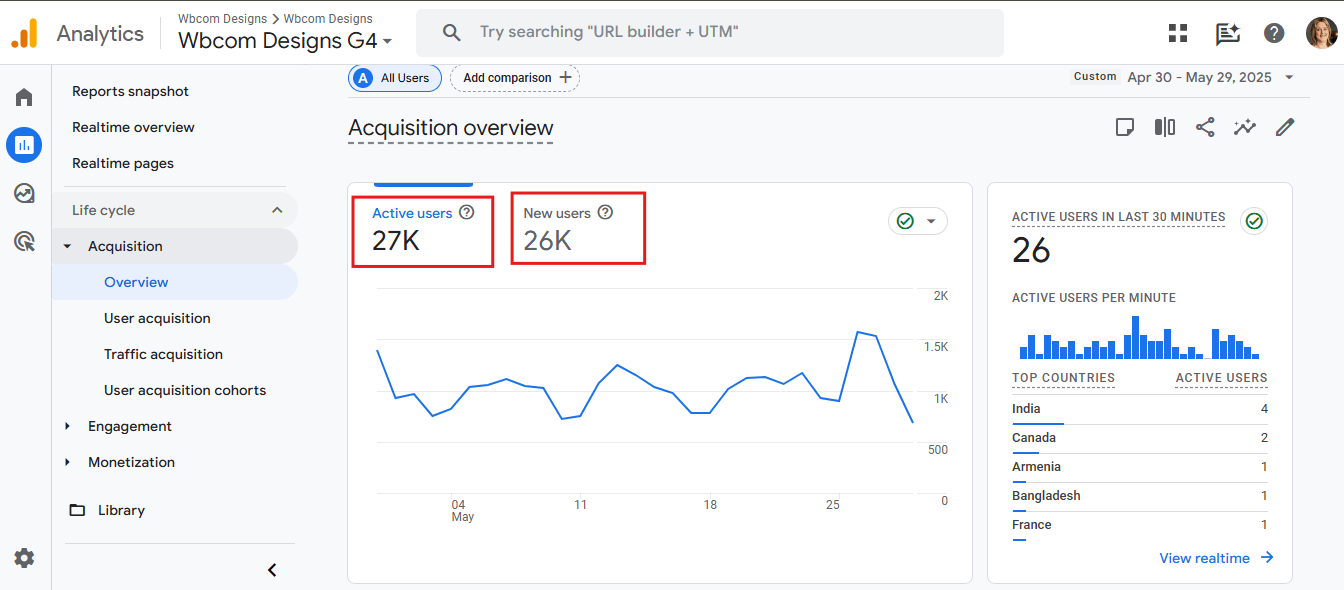
How to View User Metrics:
- Log into GA4.
- Go to Reports > Life Cycle > Acquisition > User Acquisition.
- Set your desired date range.
- Review breakdowns of Total Users and New Users.
These metrics help you identify trends in audience growth and provide insights into the effectiveness of marketing campaigns and website performance. Tracking users regularly gives you a benchmark for evaluating whether your strategies are working.
Acquisition: Understanding Where Your Users Come From
Acquisition is the heartbeat of digital marketing. The Acquisition Reports in GA4 tell you where your users originate — whether they found you via organic search, paid ads, social media, or direct visits. It’s like understanding the map of your customer journey: knowing where your traffic comes from helps you allocate resources, optimize marketing campaigns, and fine-tune messaging for each channel.
Key Acquisition Reports:
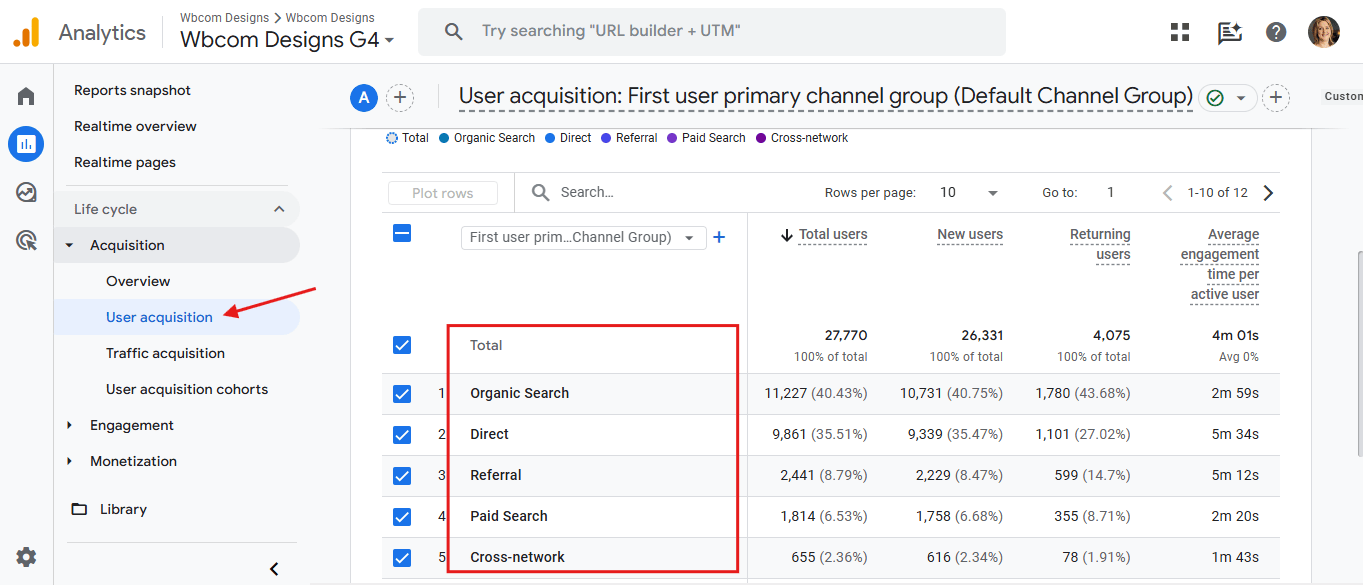
User Acquisition
Focuses on the first touchpoint that brought a user to your site. It’s perfect for understanding which channels are driving first-time visitors. This is crucial for evaluating which sources are effective in attracting fresh audiences.
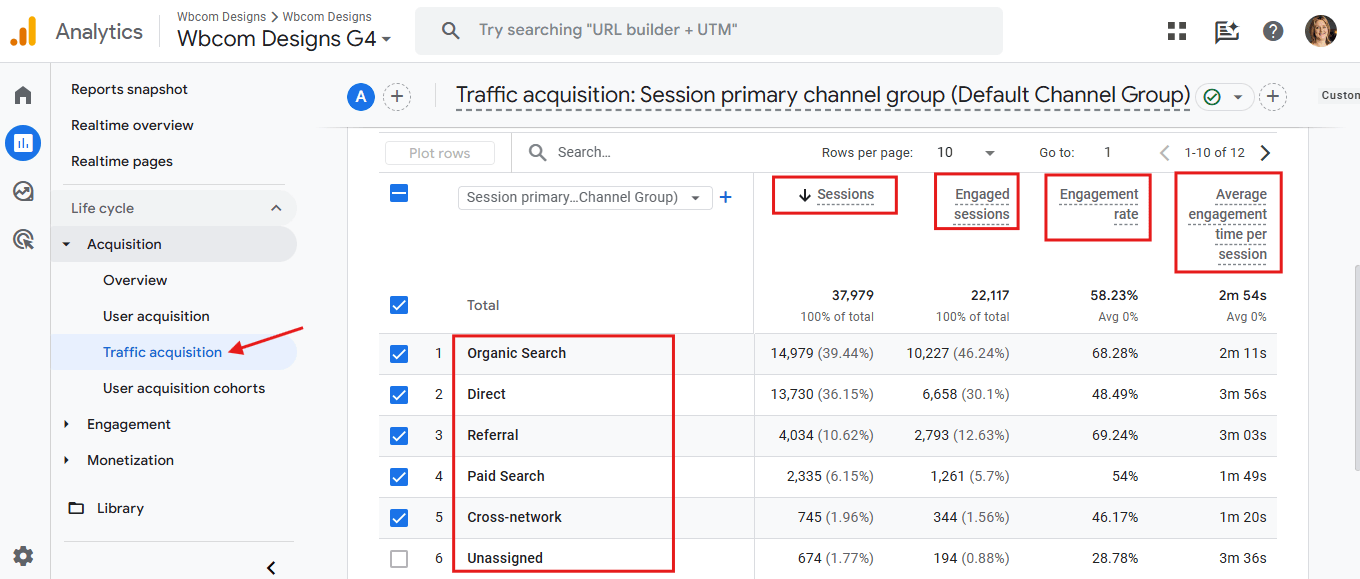
Traffic Acquisition
Looks at all sessions, showing where users came from each time they visited. This gives you a broader understanding of which channels repeatedly drive traffic, helping you refine your ongoing marketing strategies.
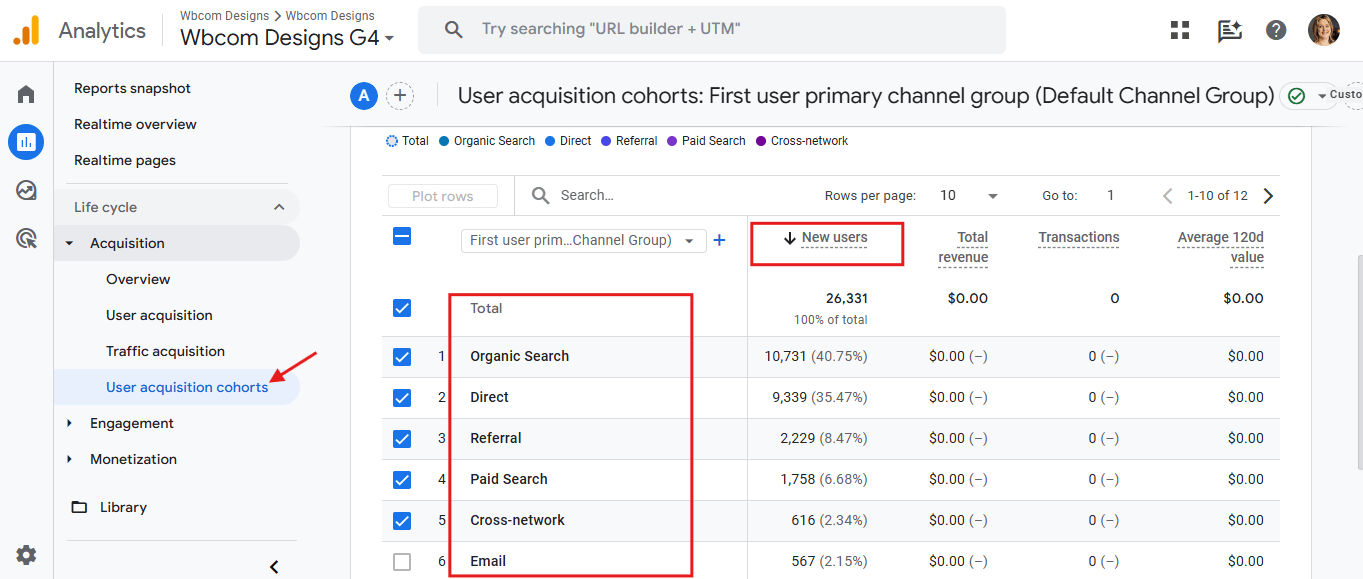
User Acquisition Cohorts
User Acquisition cohorts in GA4 group users based on when they were first acquired. Think of it as a way to analyze how different groups of new users behave over time. For example, you can track how users who first landed on your site in April continue to engage over the following weeks. This helps you identify patterns, measure retention, and see how well your marketing efforts attract users who stick around. It’s like a window into user loyalty and engagement trends across different time periods, giving you insights to refine your marketing strategies for long-term growth.
Essential Acquisition Metrics:
- Users: Unique visitors to your site/app. Each user is counted once, regardless of how many sessions they initiate.
- New Users: Those visiting for the first time. A critical metric for evaluating user acquisition strategies.
- Sessions: Total sessions started by users. This tells you how often your audience is interacting with your content.
- Conversions: The number of times users completed a goal (like purchases or sign-ups). This is the metric that reflects the true value of your website traffic.
Engagement in GA4: The Pulse of User Interaction
Engagement is where the magic happens—it’s all about how users are actually interacting with your site or app, not just visiting it. GA4’s Engagement reports give you a window into the quality and depth of these interactions, showing whether users are sticking around, clicking, scrolling, or converting. If Acquisition is about getting people through the door, Engagement tells you what they’re doing once inside.
Key Engagement Reports
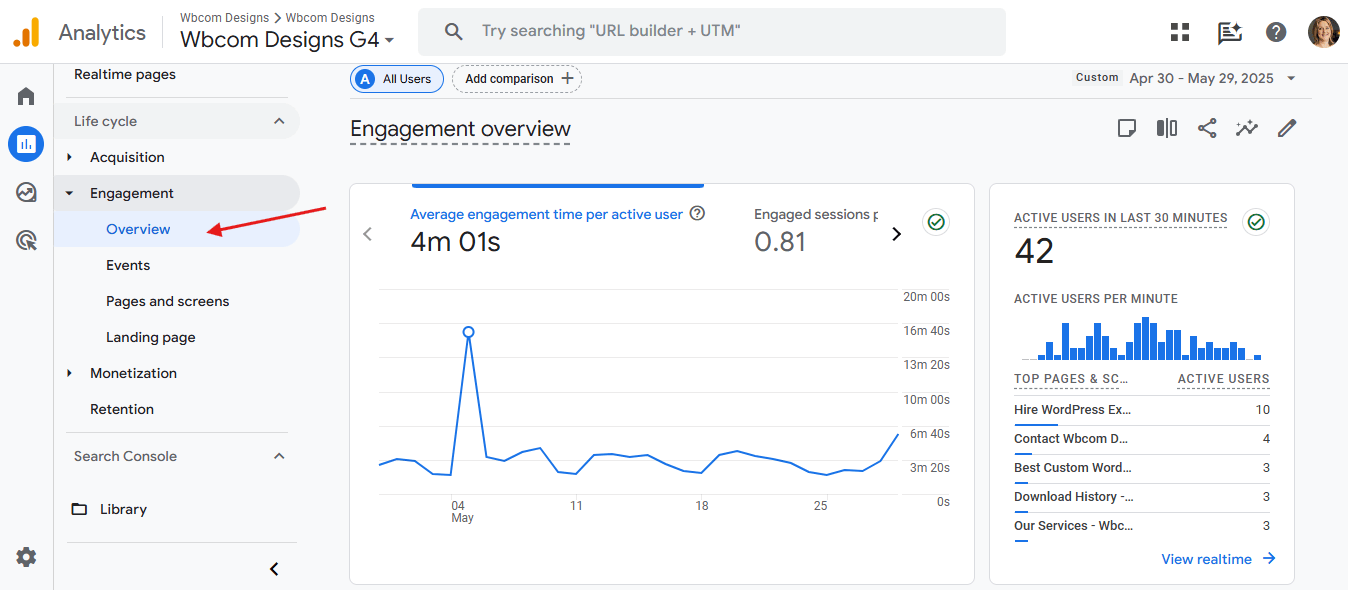
Engagement Overview
This is your big-picture dashboard, giving you a bird’s-eye view of user engagement trends over time. It summarizes vital metrics like engaged sessions, engagement rate, and average engagement time, helping you track whether users find your content compelling enough to stay, explore, and return.
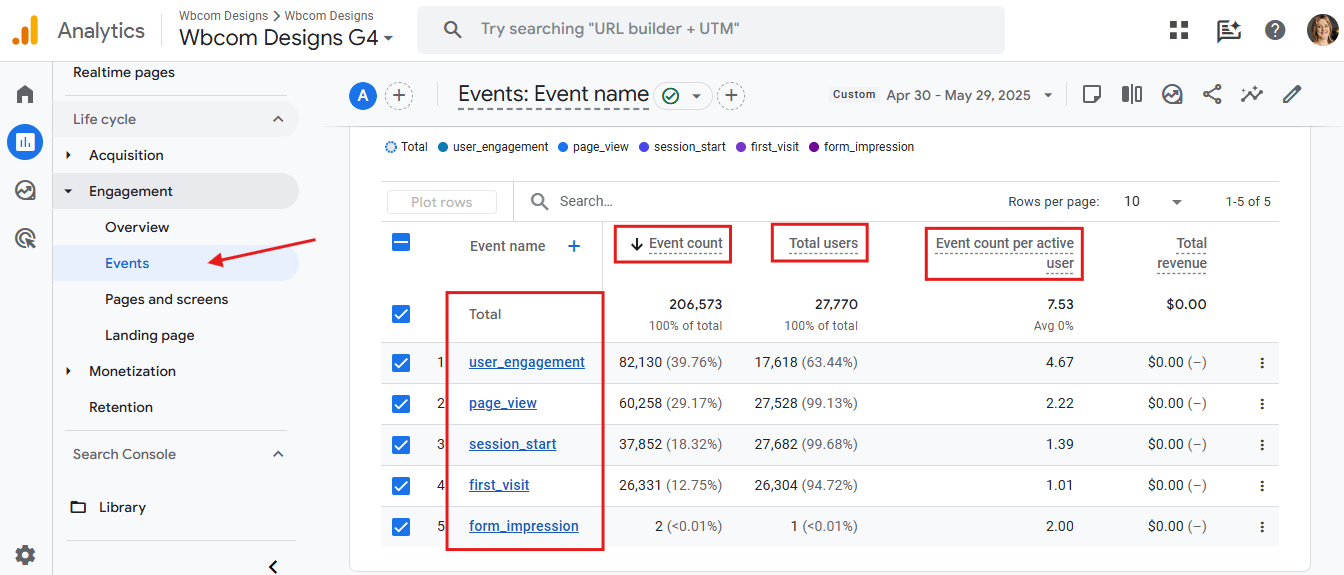
Events Report
Every interaction counts here. The Events report breaks down specific user actions—like clicks on buttons, video plays, downloads, or form submissions. It’s the granular insight that lets you pinpoint exactly which elements of your site or app are resonating with users and which might need a tweak.
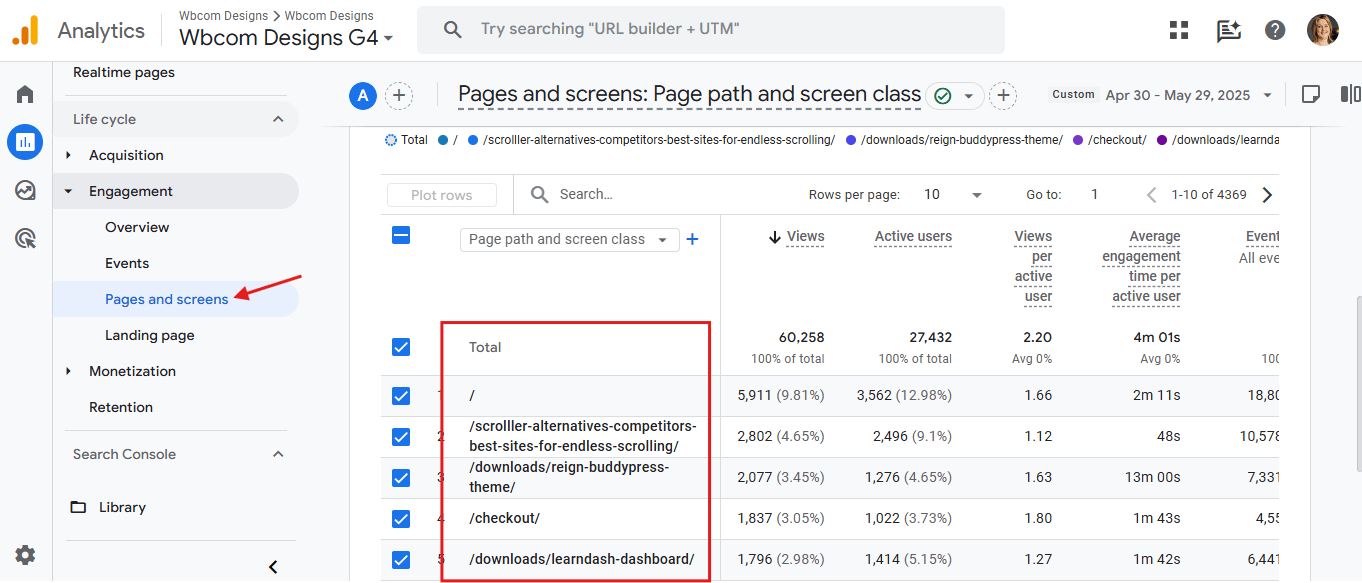
Pages and Screens
This report highlights the actual content that users consume—whether that’s web pages or app screens. It shows which pages or screens get the most attention, helping you understand what’s working and where users might be dropping off.
Important Engagement Metrics Explained
-
Engaged Sessions:
These are sessions where users show meaningful interaction—lasting longer than 10 seconds, triggering a conversion event, or visiting multiple pages/screens. Engaged sessions signal real interest, not just fleeting visits, so this metric is your go-to for assessing session quality. -
Engagement Rate:
This is the percentage of sessions that qualify as engaged sessions. Think of it as a health check on your content’s ability to captivate users. A higher engagement rate means your audience is not just passing through but actually engaging deeply. -
Average Engagement Time per Session:
This tells you how long, on average, users stay actively engaged during their visit. It’s a key indicator of content relevance and user satisfaction—longer engagement times generally mean your site or app is meeting or exceeding expectations. -
Engaged Sessions per User:
This metric reveals how often an individual user engages in meaningful sessions. Higher numbers suggest loyal users who find recurring value in your content, signaling strong user retention and brand affinity. -
Event Count:
The total number of interactions (events) triggered during user sessions. This metric shows the volume of actions users take, offering clues about which features or content pieces drive interaction. -
Events per Session:
This average indicates how many events occur in each session. More events per session mean users are actively exploring and interacting, which is a good sign your site or app is engaging. -
Views:
Total pageviews or screen views give you a sense of overall traffic volume and content consumption patterns. This raw count helps in understanding which pages or screens attract the most eyeballs. -
Views per User:
This is the average number of pages or screens viewed per user. Higher views per user often indicate users are exploring beyond just the landing page, signaling strong content interest.
Events:
In GA4, Events represent any specific user action or interaction on your website or app. Unlike the previous versions where pageviews were king and events were a separate add-on, GA4’s event-based model tracks everything uniformly. This means every interaction — whether it’s a pageview, button click, video play, or file download — is an event. This uniform approach gives you granular control to track exactly what matters for your business goals.
Types of Events in GA4
-
Automatically Collected Events: GA4 comes ready out of the box tracking fundamental actions like page views, scrolls, outbound clicks, site searches, video engagement, and file downloads. No extra setup needed here — these are the “freebies” Google gives you.
-
Recommended Events: These are industry-specific events Google suggests you implement, tailored to your business. For example, e-commerce sites get recommended events like “purchase” or “add_to_cart,” while SaaS businesses might focus on “sign_up” or “trial_start.”
-
Custom Events: When your business has unique interactions that matter — like “newsletter_signup” or “product_share” — you can define custom events. This is where GA4 really shines, letting you tailor your analytics to your exact needs.
Why Events Matter
Events are your direct window into user behavior. They tell you not just who’s visiting but what exactly they’re doing, how they’re engaging, and where they might be dropping off. By monitoring events, you can measure how well your content, features, and marketing campaigns are performing, and identify opportunities to optimize user experience and boost conversions.
How to Track and Manage Events
- View Automatically Collected Events: Head to Configure > Events to see all events GA4 is tracking by default.
- Create Custom Events:
-
Click Create Event.
-
Name your event (e.g., “signup_form_submitted”).
-
Set conditions to define what triggers this event — like a specific page path or button click.
-
Use DebugView to test that your event is firing correctly in real-time.
-
-
Mark Events as Conversions: If an event reflects a business goal (like “purchase” or “contact_form_submission”), you can mark it as a conversion by going to Configure > Conversions > New Conversion Event and adding the event name.
GA4’s event-driven data model empowers you to dissect user interactions with laser precision. Whether tracking standard user actions or custom behaviors, events give you the pulse of your website or app, enabling smarter decisions and optimized growth. So, embrace the event culture and turn raw interactions into actionable insights.
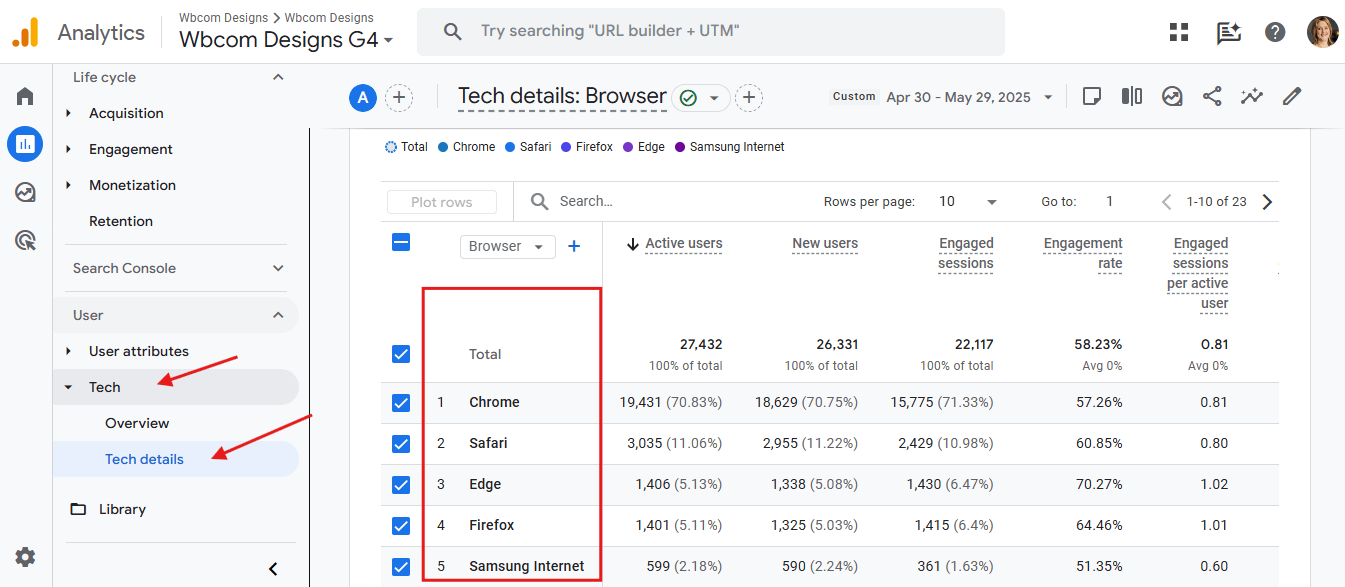
Tech Data: The Digital Fingerprint of Your Audience
Tech Data is your backstage pass into the world of your users’ devices and technology. It reveals exactly how your audience interacts with your site or app — from the devices they use (mobile, desktop, tablet) to the browsers they browse with, and even screen resolutions and operating systems.
- You can add Filters according to the insight category you want like Browser, Device Category, Platform etc.

Why does this matter?
Because knowing your users’ tech profile helps you design better experiences. If 80% of your visitors are on mobile, but your mobile site is sluggish, you’re leaving money on the table. If users are on older browsers, you can optimize for compatibility.
Where to Find Tech Data:
- Head over to Reports > Tech in your GA4 dashboard.
- You’ll see insights like Device Category, Operating System, Browser, and Screen Resolution.
Tech Data is about reading the digital fingerprints of your audience so you can serve them better, faster, and smarter.
Demographics: Who’s Behind the Screen?
Knowing who your users are is just as important as knowing what they do. GA4’s demographics reports give you a snapshot of your audience’s age, gender, interests, and geographic location—data gold for crafting targeted, relevant marketing campaigns.
- Age and Gender: Understand which groups engage most with your content. Are millennials your core audience, or is Gen Z dominating?
- Interests: Discover what topics or categories your users are into, so you can tailor content and ads that truly resonate.
- Location: Pinpoint where your users live, enabling region-specific campaigns and language customization.
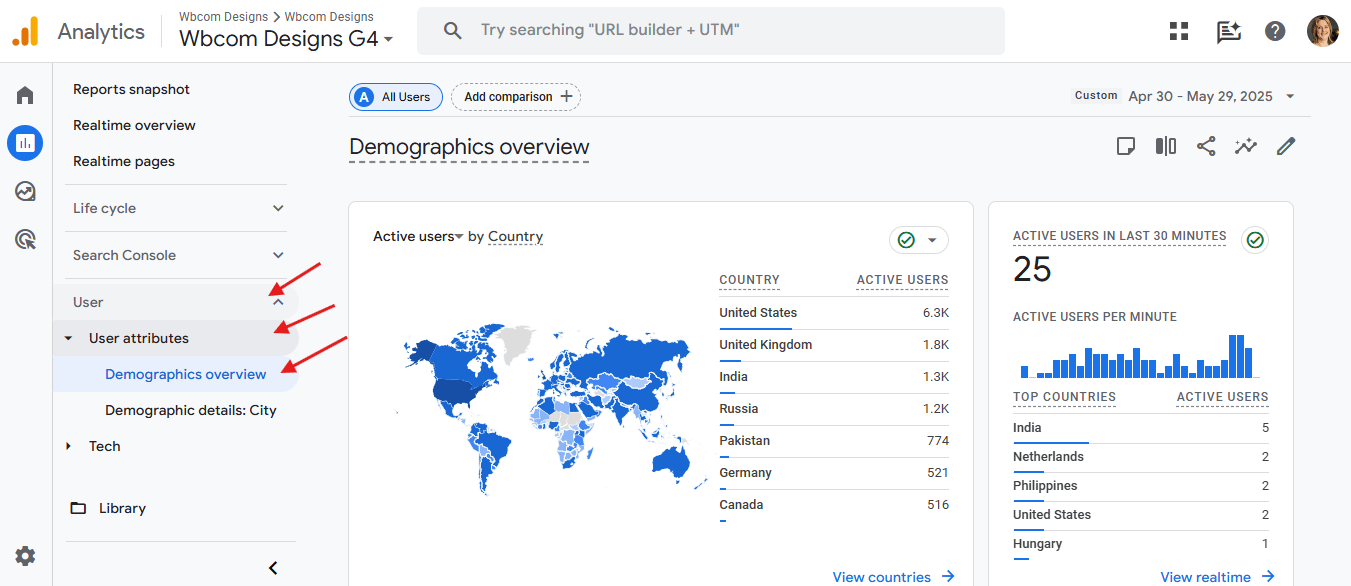
Accessing Demographics Data:
- Go to Reports > User > User Attributes > Demographics in GA4.
- To enhance demographic data, turn on Google Signals under Admin > Data Settings > Data Collection. This feature enables more robust cross-device reporting and audience insights.
- Keep in mind, demographics data takes up to 24 hours to appear after activation.
By leveraging demographics, you move from guesswork to precision marketing. You don’t just reach people—you connect with the right people.
Real-Time in GA4: Your Website’s Pulse, Minute by Minute
RealTime in GA4 is like watching your website in action, live. It shows you who’s on your site right now — how many users, where they’re from, which pages they’re viewing, and how they found you.
This feature is a must-have for marketers during campaigns, promotions, or product launches. Let’s say you send out a new email blast. Real-Time lets you see instantly if it’s driving traffic, so you’re not left guessing.

How to Access Real-Time:
- In your GA4 dashboard, go to Reports > Real-time.
- You’ll get a 30-minute snapshot of your audience activity — a live stream of engagement.
Real-Time is your instant feedback loop — helping you react fast, adjust quickly, and capitalize on what’s working in the moment.
Funnel in GA4: Mapping the Customer Journey
Funnels in GA4 are where you trace your users’ steps. Whether it’s from the homepage to the product page, then to checkout, or a newsletter sign-up journey, funnels give you a visual map of how users flow through your website or app.
You can build custom funnels, define specific steps, and analyze where users drop off. This is crucial — if users abandon at the “add to cart” step, you know exactly where to investigate.
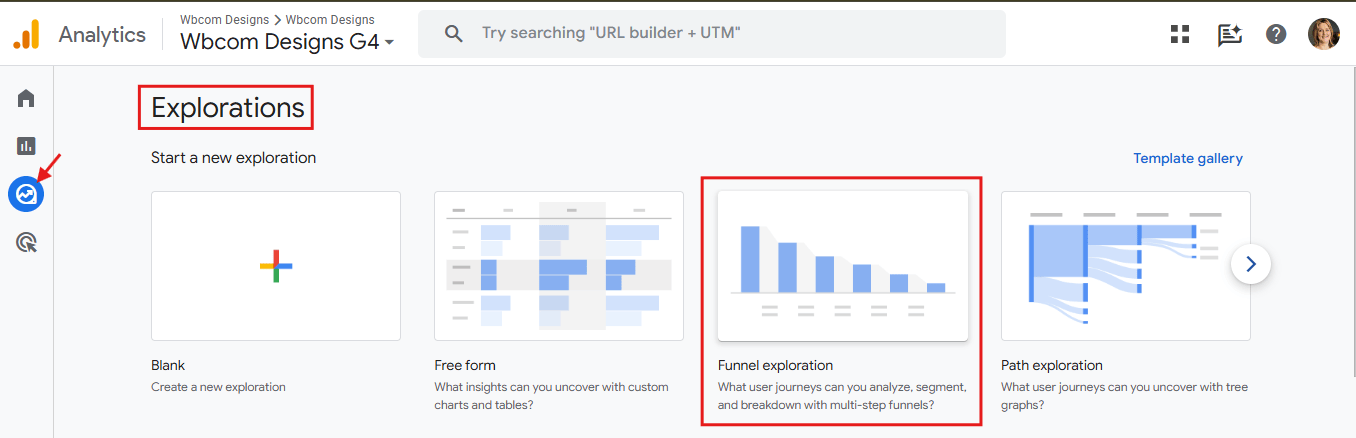
How to Build a Funnel:
- Go to Explore > Funnel exploration.
- Define each step in your funnel (like Page View > Product View > Add to Cart > Purchase).
- Watch your funnel light up with data — see completions and drop-offs at every stage.
Funnels aren’t just pretty charts — they’re actionable insights that help you optimize user flow, plug leaks, and drive conversions.
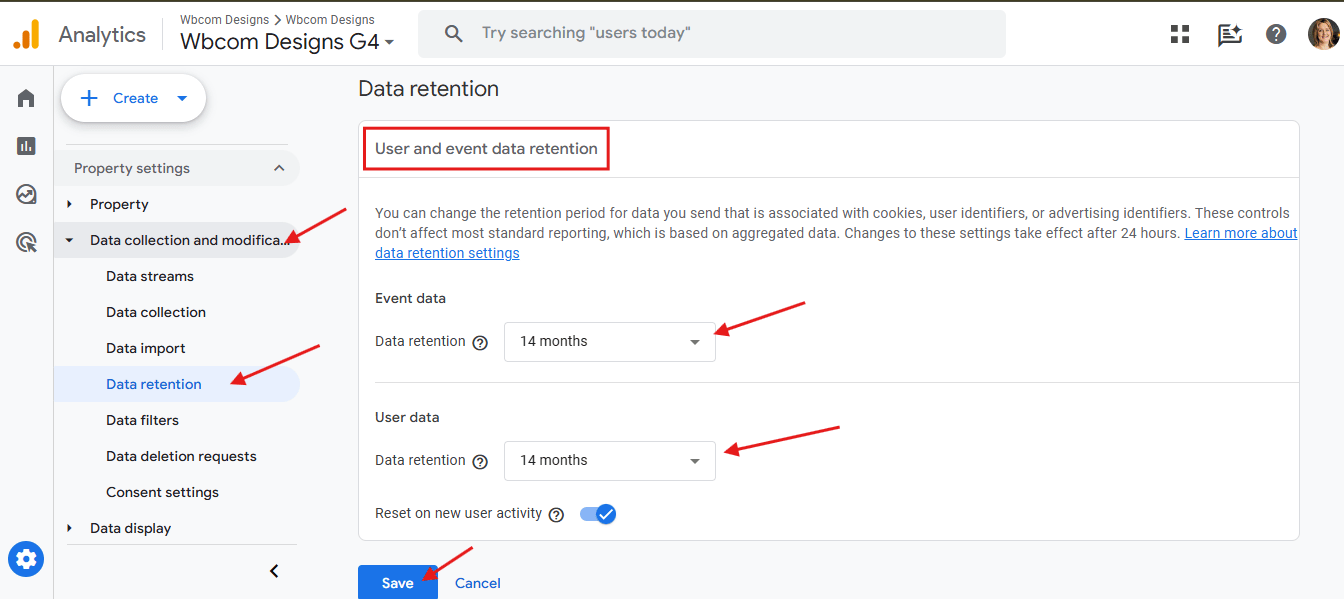
Data Retention: Controlling How Long You Keep User Data
Data Retention in GA4 is like your cleanup crew — it controls how long user-level and event-level data sticks around in your reports.
By default, GA4 holds onto this data for 2 months, but you can extend it to 14 months. After that, GA4 automatically wipes user-specific data (like device IDs and user properties) from its servers — no manual clean-up needed.
Why It Matters:
- If you need longer-term insights (think year-over-year trends), you’ll want to extend the retention period.
- If you’re handling sensitive user data, shorter retention might be the safer bet to reduce risk.
- Aggregate data like totals and trends won’t be affected, so your high-level reports stay intact.
How to Adjust Data Retention Settings:
- Go to Admin > Data Settings > Data Retention in your GA4 dashboard.
- Choose between 2 months or 14 months.
- Done — GA4 will handle the rest, like a silent guardian for your data.
Data Retention isn’t about hoarding data — it’s about finding the right balance between insights and responsibility.

Wrapping It Up: Your GA4 Game Plan
Embarking on your GA4 journey involves understanding and setting up key metrics to gain valuable insights into user behavior and site performance. By comprehensively analyzing users, sessions, events, conversions, demographics, technology usage, real-time data, user journeys, and privacy settings, you can make informed decisions to enhance your digital presence.
Remember, the transition to GA4 is a step toward more flexible and detailed analytics. Take the time to explore its features, customize your tracking to align with business goals, and stay informed about updates and best practices.
Interesting Reads:
10 Best Metabase Alternatives and Competitors