
Course completion rates on self-paced online courses are notoriously low - industry research on MOOCs and self-paced LMS courses has repeatedly found completion rates well under 15% when there’s no structured accountability built into the experience. That’s not a content-quality problem in most cases; it’s a self-regulation problem. Learners who can’t easily see their own progress, can’t tell what’s left, and have no lightweight way to capture their own thinking as they go tend to lose momentum quietly, long before they consciously decide to quit. The LearnDash Dashboard plugin’s Student View and the companion LMS Notes plugin both target that specific failure point, and understanding the learning-science reasoning behind them makes the configuration decisions much clearer than treating them as a generic features list.
Why Progress Visibility Changes Completion Behavior
Self-regulated learning theory - the academic framework most instructional designers reference when talking about learner motivation - identifies self-monitoring as one of three core cyclical phases, alongside forethought (planning) and self-reflection (evaluating outcomes). The practical implication is specific: learners who can see concrete, current evidence of their own progress are measurably more likely to set and revise realistic goals mid-course, rather than either overestimating how much they’ve done (and losing urgency) or underestimating it (and abandoning out of discouragement). A dashboard tile showing “6 of 10 lessons complete” isn’t decoration; it’s the specific input that self-monitoring depends on.
This is why LearnDash’s default admin-facing reporting, useful as it is for instructors and administrators, doesn’t solve the completion problem on its own - that data exists, but it isn’t in front of the student at the moment they’d actually use it to recalibrate. LearnDash Dashboard’s Student View closes that specific gap by surfacing the same category of data - enrolled, active, and completed course counts, assignment and essay status, quiz history - directly in the student’s own logged-in experience, on a schedule they control rather than a report someone else has to generate and share.
What the Student View Dashboard Actually Shows
The dashboard’s tile-based overview covers the counts that matter for a quick self-check: enrolled, active, and completed courses; pending and approved assignments; graded and ungraded essays; and certificates earned. The course-detail view, filterable to a specific course, breaks that down further into course progress, quiz progress, and assignment progress individually - useful specifically because a learner who’s behind on quizzes but current on lessons needs a different next action than one who’s behind on lessons entirely, and a single aggregate percentage would mask that distinction.
The course activity feed and quiz attempt history serve the self-reflection phase of the cycle rather than self-monitoring - letting a learner look back at what they got wrong on a previous attempt before retrying, or review the pace of their own recent activity rather than relying on memory. This is a meaningfully different use case from the live progress tiles, and it’s worth configuring both rather than treating the dashboard as a single monolithic feature, since they support different points in a learner’s actual study cycle.
Configuring the Dashboard Views for Different Course Types
Not every course benefits from the same dashboard emphasis, and the plugin’s four distinct role-based views (admin, instructor, group leader, student) are worth configuring deliberately rather than left at default for every course type on a site running mixed content.
Cohort-based courses with fixed deadlines benefit most from the course activity feed and announcements section prominently placed, since the goal is keeping a group moving together on a schedule - a learner falling behind the cohort needs that visible fast, not buried under a general dashboard.
Fully self-paced courses with no deadline benefit more from the progress tiles and quiz history than the activity feed, because there’s no shared pace to compare against - the self-monitoring signal that matters is the learner’s own trajectory over time, not relative standing against a cohort.
Certification-track courses should surface the certificates tile and completed-course count prominently, since the terminal goal (a specific credential) is what sustains motivation better than incremental lesson counts for this audience specifically.
LMS Notes: Capturing Thinking Where It Happens
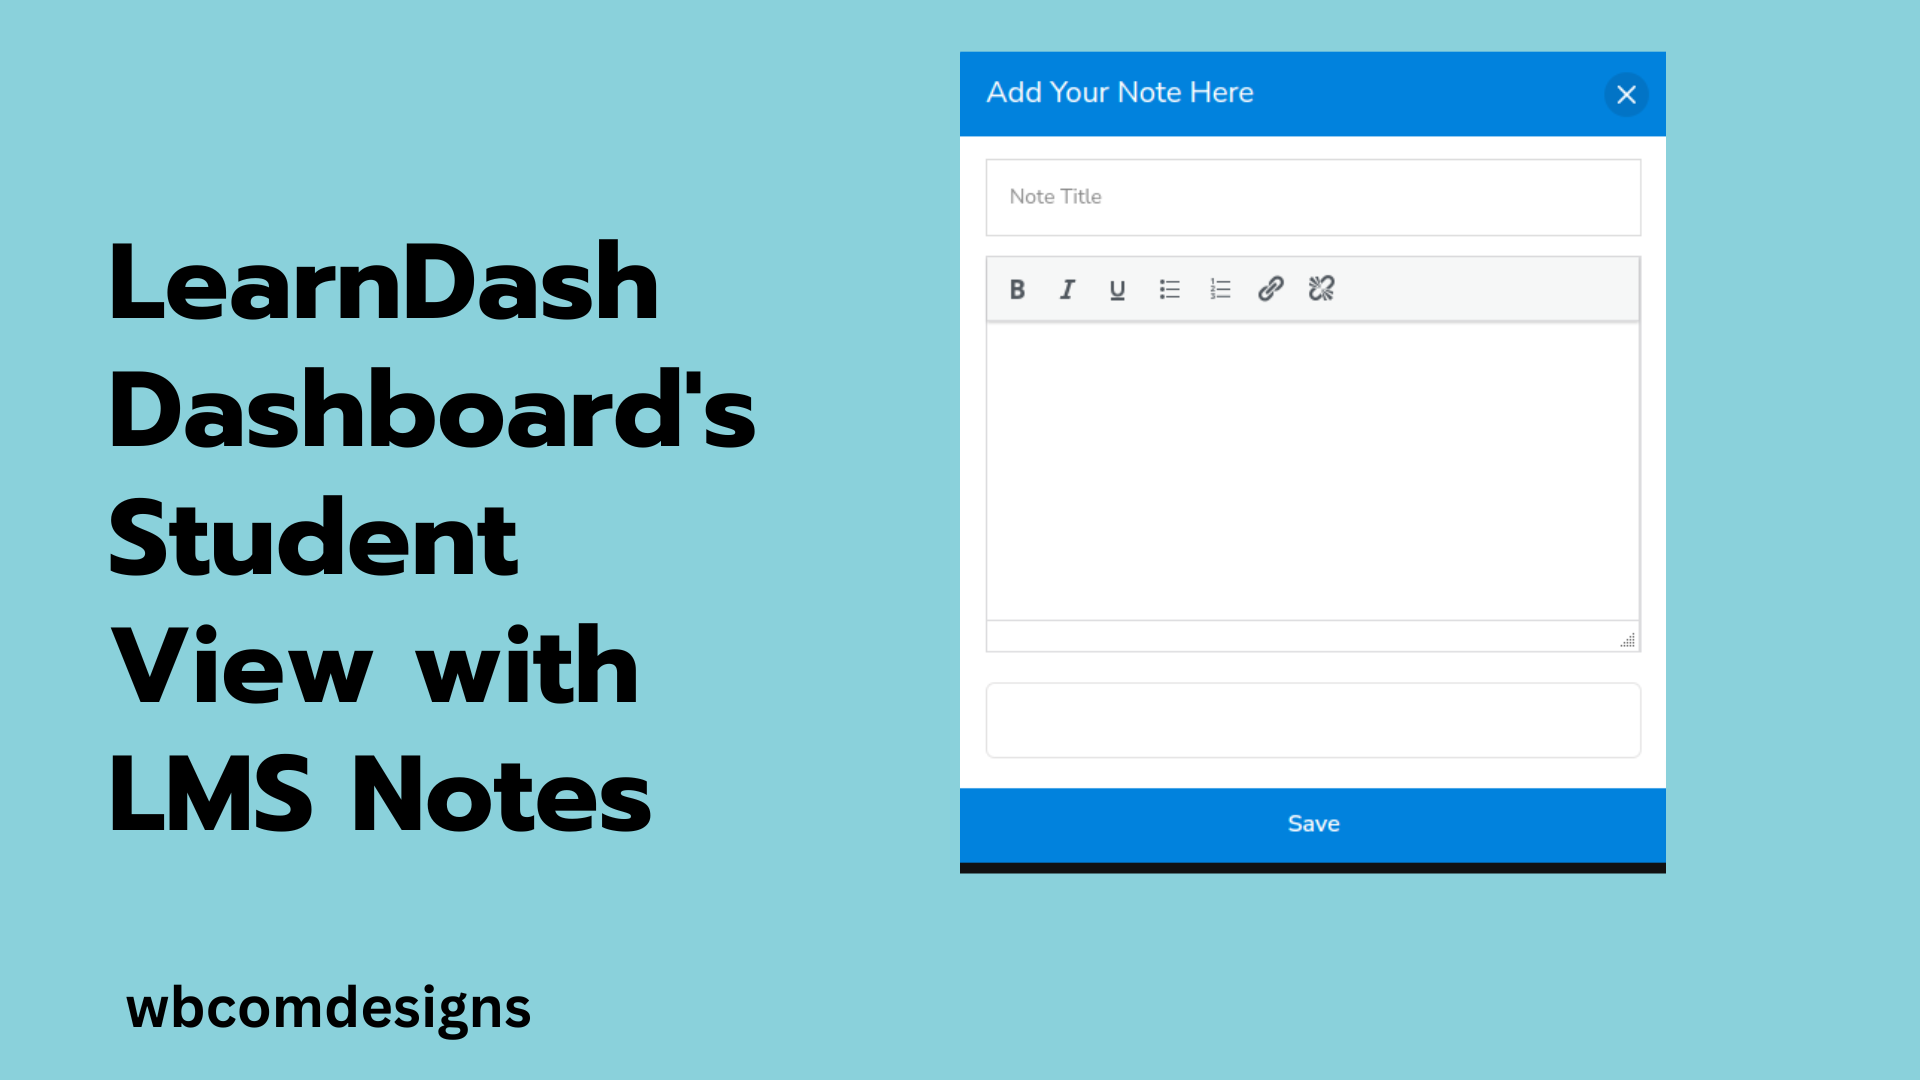
The LMS Notes plugin solves a different, complementary problem - not progress visibility, but active engagement with the material itself. The cognitive research behind note-taking during learning (the generation effect, and elaborative encoding more specifically) consistently shows that learners who actively restate or question material in their own words retain it better than learners who passively consume the same content, even when total study time is identical. A notes feature attached directly to the lesson, topic, or quiz a learner is currently working through removes the friction of switching to a separate document or app, which matters more than it sounds - that friction is exactly the point where most learners simply skip the note-taking step entirely.
LMS Notes supports LearnDash, LifterLMS, Sensei LMS, and Tutor LMS, which matters for any site running mixed LMS plugins across different course lines, and notes attach at the course, lesson, topic, or individual quiz-question level - granular enough that a learner can leave a specific question-level note (“I keep confusing this with the previous concept”) rather than a generic course-level comment that loses that specificity by the time they review it later.
The Instructor-Facing Side of Notes
Notes visibility to instructors and admins is what turns this from a purely personal study tool into a genuine feedback loop. An instructor scanning student notes across a cohort can spot a recurring point of confusion - several students independently noting the same concept as unclear - well before it shows up as a cluster of wrong answers on a quiz, which is a meaningfully earlier and more specific signal than aggregate quiz performance alone provides. The comment-based feedback feature lets an instructor respond directly to a specific note, which keeps that feedback tied to the exact point of confusion rather than a generic end-of-module comment that the learner has to re-contextualize themselves.
Configure notes visibility deliberately based on your course’s actual instructional model: fully open (instructor sees all notes by default) suits small cohort courses where an instructor is actively monitoring; a more limited default, with students opting in to share a specific note, suits larger self-paced catalogs where full instructor review of every learner’s private notes isn’t practically feasible and treating all notes as private-by-default respects that most self-paced learners are using notes as a personal study tool rather than a public discussion.
A Sample Configuration Walkthrough for a Multi-Course Certification Program
Consider a professional certification program running six sequential courses across roughly four months, where a learner isn’t certified until every course is completed. The dashboard view for this program leads with the certificates tile and a course-sequence progress indicator rather than a generic enrolled/active/completed breakdown, since the terminal goal - the full certification, not any single course - is what needs to stay visible throughout. Each course’s individual completion also triggers a dedicated notification distinct from the generic “lesson complete” message, specifically framed around progress toward the overall certification (“3 of 6 courses complete”) rather than just the immediate course, since research on goal-gradient effects shows learners are measurably more motivated as they perceive themselves closing in on a larger, named goal.
LMS Notes gets configured with instructor visibility open by default across this program, since a cohort moving through the same sequence together benefits from an instructor catching a recurring point of confusion early across all six courses rather than course-by-course in isolation. Quiz attempt history stays visible to learners throughout, since a certification program specifically benefits from letting learners revisit earlier material before a later, cumulative assessment - a self-monitoring use case the dashboard’s default configuration doesn’t automatically optimize for unless it’s deliberately set up this way.
Interpreting the Data: What Good Engagement Actually Looks Like
Once the dashboard and notes are live, it’s worth being specific about what the resulting engagement data should actually look like, since instructors new to reading this kind of data sometimes misread perfectly healthy patterns as warning signs. A learner who checks their progress dashboard infrequently but consistently completes lessons on schedule is not disengaged - some learners are naturally lower-monitoring and rely more on external deadlines than on self-tracking, and dashboard-check frequency alone is a weak signal in isolation. What’s genuinely worth watching is a learner whose lesson-completion pace has visibly slowed relative to their own earlier pace within the same course, combined with a period of zero dashboard or notes activity - that combination, not either signal alone, is the pattern that reliably precedes a learner quietly dropping out rather than actively withdrawing. Instructors and group leaders reviewing ProPanel’s cohort-level view should specifically look for that combined pattern across their roster rather than treating low individual-session engagement as automatically concerning, since over-flagging normal variation in study habits as a problem just adds noise that makes the genuine warning signs harder to spot.
Common Configuration Mistakes Worth Avoiding
A handful of setup mistakes show up repeatedly across LearnDash Dashboard implementations. Leaving every course on the identical default dashboard emphasis regardless of whether it’s cohort-based, self-paced, or certification-track, missing the differentiated configuration described above that actually matches each course type’s real motivational structure. Enabling LMS Notes with instructor visibility fully open on a large, self-paced catalog with no active cohort monitoring, which creates a review burden no instructor is realistically going to keep up with and quietly turns into a feature nobody checks. Failing to test the dashboard’s mobile layout before launch, despite a meaningful share of self-paced learners checking progress from a phone between other commitments. And treating ProPanel and Student View as redundant rather than complementary, leading instructors to check only one and miss information the other was specifically built to surface.
Where This Fits With LearnDash’s Native ProPanel Reporting
LearnDash’s own ProPanel add-on (bundled with the Plus and Pro plans) provides broader administrative analytics - cohort-wide completion trends, filterable reporting exportable to CSV, and progress-distribution charts aimed at instructors and administrators making programmatic decisions about a course. LearnDash Dashboard’s Student View is not a replacement for that reporting layer; it’s the student-facing complement to it - ProPanel answers “how is this cohort doing as a group,” while Student View answers “how am I doing, right now, as this specific learner” in the moment a student is actually deciding whether to keep going. Sites running both get the full picture: administrative visibility for the people managing the course, and self-monitoring visibility for the people taking it.
Accessibility and Mobile Considerations
A progress dashboard that’s difficult to read on a phone defeats a meaningful share of its own purpose, since a large proportion of self-paced learners check progress in short mobile sessions between other commitments rather than sitting down at a desktop specifically to review a dashboard. Verify the dashboard’s tile layout reflows sensibly at common mobile breakpoints before launch, and check that the course-detail filter dropdown remains usable with touch input rather than assuming desktop-tested interactions translate directly. For screen reader users, confirm that progress percentages and tile labels are exposed as readable text rather than relying purely on a visual progress bar with no accompanying numeric label - a bar with no text equivalent communicates nothing to a learner using assistive technology, which directly undermines the self-monitoring purpose the whole feature exists for.
Gamification and the Dashboard: A Complementary Layer
Progress visibility and note-taking address the self-monitoring and active-engagement components of self-regulated learning, but a third factor - sustained motivation over a long course - benefits from a layer many sites add alongside the dashboard rather than instead of it: points, badges, and leaderboards tied to genuine course milestones rather than vanity actions. The dashboard’s certificate and completed-course tiles already function as a lightweight form of this, giving learners a visible marker of achievement, but a site running a longer, multi-course program often benefits from a dedicated gamification layer that recognizes intermediate progress, not just final completion, since the multi-week gap between enrollment and certificate is exactly where motivation is most likely to erode. The important design discipline, whichever gamification approach is used, is tying every badge or milestone to a genuine learning action reflected in the dashboard’s own progress data, rather than a separate, disconnected point system that doesn’t correspond to anything the student dashboard actually shows - disconnected systems create confusion rather than reinforcement.
Rolling Out the Dashboard on an Existing, Already-Enrolled Course
Adding the Student View dashboard to a course that already has active learners enrolled, rather than one still being built, needs a slightly different rollout than a fresh course launch. Communicate the addition directly to enrolled learners - a short announcement explaining what the new dashboard shows and where to find it - rather than letting them discover it silently, since a meaningful share of learners simply won’t notice a new navigation element added mid-course without being told it exists. For a cohort already partway through a course, the historical progress data populates correctly from existing completion records, so there’s no need to ask learners to redo anything, but it’s worth verifying this data populated accurately for a sample of existing learners before the wider announcement, since a misconfigured rollout that shows incorrect progress counts to already-enrolled learners does more harm to trust in the feature than not having launched it at all.
Communicating the Feature to Instructors, Not Just Learners
Rolling out the dashboard successfully depends as much on instructor buy-in as learner adoption, and this is the half of the rollout that gets skipped more often. An instructor who doesn’t understand how to read the course activity feed or hasn’t been shown the difference between a normal engagement dip and the genuine warning-sign pattern described above will either ignore the dashboard entirely or over-react to normal variation, both of which undermine the feature’s purpose. A short training session for instructors specifically covering what the data does and doesn’t mean - using real, anonymized examples from the site’s own course history if any exist - is a better investment than assuming instructors will intuitively know how to interpret a new reporting surface just because it’s been added to their dashboard.
Setup Sequence That Avoids the Common Mistakes
1. Install and configure LearnDash Dashboard first, and set role-based view permissions deliberately rather than leaving every role at the default - a course author role that shouldn’t see other instructors’ cohort data is a common oversight worth checking explicitly.
2. Decide your notes visibility default (open vs. private-by-default) based on course type before installing LMS Notes, not after learners have already started creating notes under one assumption.
3. Test the mobile layout and screen reader labeling before launch, not as a post-launch fix - both plugins render learner-facing UI that a meaningful share of your actual audience will use on a phone.
4. If you’re also running ProPanel, treat the two as complementary rather than redundant, and make sure instructors know which one answers which question rather than checking both out of habit.
5. If adding a gamification layer, tie every badge or milestone explicitly to a progress event the dashboard already tracks, rather than running a parallel, disconnected point system.
6. Match dashboard emphasis to course type deliberately - cohort-based, self-paced, and certification-track courses each benefit from a different configuration, not the same default applied uniformly.
7. If rolling out to an already-enrolled cohort, verify historical data populated correctly for a sample of learners before announcing the feature widely.
8. Train instructors specifically on how to read engagement data before launch, not just learners on how to use the dashboard.
The Bottom Line
The value of LearnDash Dashboard’s Student View and LMS Notes isn’t the feature list itself - it’s that both plugins target the specific, well-documented failure point behind low self-paced course completion: learners losing the ability to self-monitor and actively engage once the material moves past a live classroom setting. Configure the dashboard emphasis to match your course’s actual pacing model, set notes visibility deliberately rather than by default, verify both work on mobile and with assistive technology, train instructors on what the engagement data actually means, read that data with an understanding of what a genuine warning sign actually looks like, and layer any gamification on top of the same progress data rather than alongside it - and you’ve built a genuine accountability structure into a self-paced course rather than just adding a stats page nobody checks.