
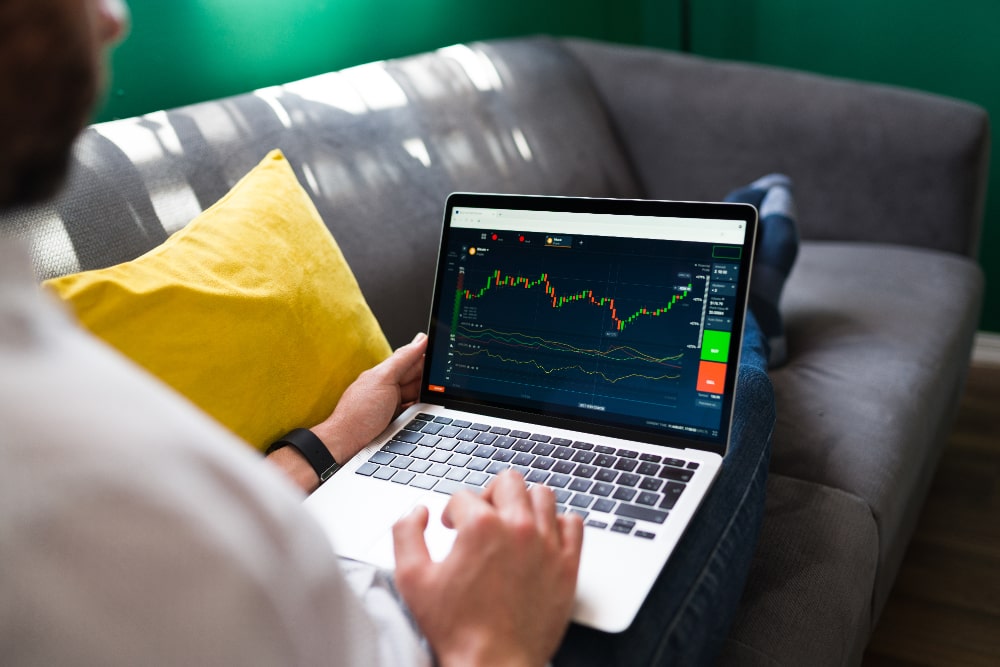
The cryptocurrency market is a dynamic and often unpredictable landscape, and price charts alone rarely tell the full story of what’s actually happening beneath a move. While price trends grab most of the attention, trading volume analysis is an equally important metric, one that reveals market sentiment, liquidity, and whether a price movement has real conviction behind it or is likely to reverse.
This guide covers the fundamentals of trading volume analysis in crypto markets: what it measures, why it matters, how to read it alongside price action, and the specific indicators and habits that separate traders who use volume well from those who ignore it entirely. Whether you’re new to crypto or have been trading for years, understanding volume data sharpens decision-making in a market that moves fast and punishes guesswork.
What Is Trading Volume in Crypto Markets?
Definition
Trading volume refers to the total number of units of a cryptocurrency traded over a specific period, usually reported over 24 hours on most exchanges and data aggregators. It measures market activity and liquidity, giving a real-time indicator of interest and demand for a given asset.
Key characteristics
- High volume generally signals strong market interest and better liquidity, meaning trades execute closer to the quoted price.
- Low volume suggests limited trading activity, which often leads to wider spreads and sharper price swings on relatively small orders.
A simple example
If 5,000 Bitcoin change hands within a 24-hour window across tracked exchanges, the reported trading volume for BTC in that timeframe is 5,000 BTC, typically also expressed in the equivalent dollar value at the time of each trade.
Why Trading Volume Matters
Assessing market sentiment
- High volume during price increases signals strong bullish conviction behind the move.
- High volume during price decreases indicates strong bearish sentiment rather than a temporary dip.
- Low volume accompanying a price movement, in either direction, suggests weak conviction, which often precedes a reversal or a stall.
Identifying liquidity
High trading volume generally means better liquidity, which lets traders enter or exit positions with less slippage, the gap between the price you expect and the price you actually get filled at.
Confirming price trends
Volume often acts as a confirmation tool for price trends. A significant price move accompanied by high volume is more likely to hold than the same move on thin volume, which is one reason experienced traders check volume before treating any breakout as real.
How to Analyze Trading Volume in Crypto
1. Volume spikes
Sudden, large spikes in trading volume often coincide with breaking news, a major exchange listing, or the start of a significant, sustained price movement. A spike with no obvious news catalyst is worth investigating before acting on it, since it can also signal unusual activity rather than organic demand.
2. Volume-to-price divergence
When price and volume move in opposite directions, it can signal an upcoming reversal. If prices keep rising while volume steadily decreases, the trend may be running out of genuine buying pressure and lack the momentum to sustain itself much further.
3. Volume indicators
A few widely used indicators translate raw volume data into something easier to act on:
- On-Balance Volume (OBV): tracks cumulative buying and selling pressure by adding volume on up days and subtracting it on down days.
- Volume Moving Average (VMA): smooths volume data over a set period to help identify whether current activity is unusually high or low relative to recent history.
- Money Flow Index (MFI): combines price and volume into a single oscillator, often described as a volume-weighted version of the RSI.
4. Comparing volume across exchanges
Volume figures can differ meaningfully between exchanges for the same asset. Large discrepancies can point to arbitrage opportunities, or in some cases, to reported volume that doesn’t reflect genuine trading activity, an issue that has affected parts of the crypto exchange industry and is worth staying alert to.
Also Read: Best AI Tools for Cryptocurrency Trading
Applications of Trading Volume Analysis
Validating a breakout
When an asset breaks through a well-established resistance level accompanied by a clear increase in volume, that combination is generally treated as a stronger signal than a price break on ordinary or below-average volume. Traders often use this pairing, price breaking a level plus a genuine volume increase, as one input among several before adjusting a position, rather than as a signal to act on alone.
Spotting a weak or false breakout
The opposite pattern is just as instructive. When price pushes above a resistance level but volume stays flat or even declines, that divergence is a classic warning sign of a false breakout, one where the move lacks the participation needed to hold, and price often drifts back below the broken level shortly after.
Practical use cases
- Trend validation: confirming whether a trend is genuinely supported by market participation.
- Entry and exit timing: using volume patterns alongside price levels to time trades more precisely.
- Manipulation and anomaly detection: spotting unusual spikes or cross-exchange inconsistencies that warrant a closer look before trading around them.
Advantages and Limitations of Volume Analysis
Advantages
- Better-informed decisions: volume adds meaningful context that price alone doesn’t provide.
- Improved risk management: divergences between price and volume can flag potential reversals before they’re obvious on a price chart alone.
- Broad applicability: volume analysis works across timeframes and trading strategies, from short-term scalping to longer-term position trading.
Limitations
- False signals: a volume spike doesn’t guarantee a sustainable trend, and volume alone shouldn’t be the only factor behind a trade.
- Manipulation risk: wash trading and inflated reported volume remain real problems on parts of the crypto exchange landscape, particularly on smaller or less regulated platforms.
- Added complexity: getting real value from volume analysis takes some familiarity with supporting indicators and chart patterns, it isn’t a single number you can read in isolation.
Strategies for Effective Volume Analysis
Combine volume with other indicators
- Pair volume analysis with momentum tools like RSI or MACD for a more complete picture of a potential trade setup.
Monitor news and events
- Stay current on market news so you can connect volume spikes to their likely catalyst rather than trading on an unexplained anomaly.
Use reputable data sources
Reliable volume data matters as much as the analysis technique itself. Established market data aggregators like CoinMarketCap and CoinGecko publish volume figures across exchanges and flag some of the reporting inconsistencies mentioned earlier. For charting and technical indicators built around volume, TradingView remains one of the most widely used platforms among both retail and professional crypto traders, with built-in OBV, VMA, and MFI indicators ready to apply to any chart. For on-chain and exchange flow data specifically, platforms like Glassnode, CryptoQuant, and Nansen go a level deeper, tracking wallet-level movement that raw exchange volume alone won’t show you.
Reading Volume on Different Timeframes
A single 24-hour volume figure only tells part of the story, and traders who rely on it exclusively often misread what’s actually happening. Comparing that number to the asset’s average volume over the past seven or thirty days gives far more useful context. A coin trading at twice its usual daily volume is behaving very differently from one simply continuing its normal pattern, even if the raw number looks impressive on its own.
Shorter timeframes matter more for active traders watching for intraday entries, while longer timeframes matter more for anyone assessing whether a broader trend has real staying power. A common mistake is applying short-term volume logic to a long-term thesis, treating a single hour’s spike as confirmation of a multi-month trend when it’s really just noise from one large order or a brief news cycle. Match the timeframe of your volume analysis to the timeframe of the decision you’re actually making.
Volume Profile: Seeing Where the Activity Actually Happened
Standard volume indicators show how much was traded over time, but a volume profile shows where, at which specific price levels, that trading actually occurred. This matters because price tends to react at levels where a large amount of historical volume has traded before, these zones often act as support or resistance even months after the original activity took place.
Traders who use volume profile look for the “point of control,” the single price level with the highest traded volume in a given range, since that level frequently becomes a magnet for price to revisit. High-volume nodes tend to act as areas of consolidation, while low-volume nodes, gaps where relatively little trading occurred, often get moved through quickly since there’s little historical interest anchoring price there. TradingView and several other charting platforms include volume profile tools built directly into their indicator libraries, so accessing this view doesn’t require specialized software.
Common Mistakes Traders Make With Volume Data
The most frequent mistake is treating every volume spike as meaningful. Not every spike deserves a reaction, some are driven by a single large order, an exchange-specific event, or even a data reporting glitch rather than a genuine shift in market interest. Before acting on an unusual spike, check whether the increase is showing up consistently across multiple reputable exchanges rather than isolated to just one.
A second common mistake is ignoring volume entirely during periods of low market activity, weekends, holidays, or overnight hours in major trading regions, when thin volume can make ordinary price moves look far more significant than they are. A five percent move on unusually light weekend volume carries much less weight than the same move during peak trading hours on a weekday.
The third mistake is over-relying on a single indicator. OBV, VMA, and MFI each capture volume from a slightly different angle, and using only one can produce a misleading picture. Cross-checking two or three volume-based indicators against each other, and against price action itself, catches contradictions that a single indicator alone would miss.
Building Volume Analysis Into a Broader Trading Routine
Volume analysis works best as one component of a consistent routine rather than something checked only when a trade already looks interesting. A practical habit: before entering any position, glance at both the recent volume trend and how current volume compares to the asset’s typical range. That thirty-second check catches a meaningful share of setups that look strong on price alone but lack the participation to actually follow through.
Keep a simple trading journal that notes the volume context behind each trade, not just the entry and exit price. Over time, reviewing which of your trades were backed by strong volume confirmation versus which weren’t tends to reveal a clear pattern in your own results, and that pattern is usually more instructive than any single article or indicator explanation on its own.
A Word on Verifying Any Trading Platform Before You Use It
Crypto trading draws no shortage of platforms promising sophisticated tools, guaranteed returns, or algorithmic trading edges. Some of these are legitimate; a meaningful number are not. Before depositing funds anywhere, verify that a platform is registered with a recognized financial regulator in your jurisdiction, check independent reviews rather than only testimonials on the platform’s own site, and be skeptical of any service that emphasizes minimum deposits, guaranteed profits, or academic-sounding “partnerships” as its main selling points, these are common patterns in unregulated trading platforms that have drawn regulatory action and fraud warnings in multiple countries. If a platform makes it difficult to find who actually operates it, treat that as a serious red flag rather than an oversight.
A few specific warning signs come up over and over again in regulatory fraud warnings and consumer complaints filed against unlicensed crypto trading platforms: pressure to deposit quickly before a “limited-time” bonus expires, a personal account manager who calls or messages pushing larger deposits, withdrawal requests that get delayed or denied without a clear explanation, and marketing that leans heavily on celebrity endorsements or screenshots of extraordinary returns. None of these appear on the legitimate data and charting platforms mentioned earlier, which exist to provide information, not to solicit deposits or manage funds on your behalf. If a site combines “volume analysis tools” with a pitch to open a funded trading account through them specifically, treat that combination with real skepticism and verify the entity independently before sending any money.
Financial regulators in the United States, the United Kingdom, the European Union, and elsewhere maintain public warning lists of unregistered platforms that have drawn enforcement action, and checking a platform’s name against these lists takes a few minutes and can save considerably more than that in prevented losses. When in doubt, stick to established, well-reviewed exchanges and data providers with a long operating history and clear regulatory standing rather than a newer platform whose main pitch is a proprietary edge nobody else has access to.
This matters more in crypto than in most other markets because the space has attracted a disproportionate share of fraudulent trading platforms, several of which have specifically marketed themselves using language borrowed from legitimate volume and market analysis, “advanced algorithms,” “AI-powered insights,” “institutional-grade tools”, to sound credible to traders who are genuinely trying to learn. Authorities in multiple countries have shut down and seized assets from platforms fitting exactly this profile in recent years. A tool that only shows you data, without asking you to deposit funds through it, is a fundamentally different category of product than a trading platform asking for your money, and conflating the two is how a lot of otherwise careful traders end up losing far more than they intended to risk.
Putting Volume Analysis Into Practice
None of the concepts above require expensive software or a professional trading desk to use effectively. A free TradingView account with volume and OBV indicators enabled, combined with a habit of checking CoinMarketCap or CoinGecko before entering a position, covers the fundamentals for most retail traders. The skill isn’t in accessing the data, it’s in building the habit of actually checking it every single time before you enter a trade rather than reaching for it only after a position has already moved against you and you’re trying to figure out what happened.
Start by picking one or two assets you already follow closely and spend a week simply observing how their volume behaves around news events, weekend lulls, and any price breakouts that occur. Patterns that felt abstract in a guide like this one tend to click quickly once you’re watching them unfold in real time on an asset you already understand.
Frequently Asked Questions
What is trading volume in crypto?
Trading volume measures the total number of cryptocurrency units traded within a specific period, reflecting market activity and liquidity for that asset.
Why is trading volume important for crypto traders?
Volume helps confirm price trends, assess market sentiment, and identify liquidity levels, making it one of the more reliable inputs for informed trading decisions.
How can I use trading volume to identify trends?
High volume during price increases suggests a strong, well-supported trend, while low volume during a price move may indicate weak conviction that’s less likely to hold.
What are common indicators for volume analysis?
On-Balance Volume (OBV), Volume Moving Average (VMA), and the Money Flow Index (MFI) are among the most widely used, each translating raw volume into a more actionable signal.
Can low volume impact crypto trading?
Yes. Low volume typically leads to higher price volatility, wider bid-ask spreads, and greater slippage when executing trades, especially on lower-cap assets.
How does volume relate to liquidity?
Higher trading volume generally indicates deeper liquidity, which allows trades to execute closer to the expected price with less market impact.
Are there risks to relying solely on volume analysis?
Yes. Volume alone can produce false signals, particularly on exchanges where reported volume doesn’t reflect genuine trading activity. It works best combined with price action and other technical indicators.
How can I detect potential market manipulation using volume?
Watch for unusual spikes with no clear news catalyst, and compare reported volume for the same asset across multiple reputable exchanges, large, unexplained discrepancies are worth investigating before trading around them.
Is trading volume analysis suitable for beginners?
Yes. Volume is one of the more approachable technical concepts to learn, and even a basic understanding of how it interacts with price adds real value to a beginner’s decision-making.
What tools can help with volume analysis?
Reputable options include TradingView for charting and volume indicators, CoinMarketCap and CoinGecko for cross-exchange volume data, and on-chain platforms like Glassnode, CryptoQuant, and Nansen for deeper flow analysis.
Interesting Reads
Best Cryptocurrency Payment Gateways for International Business
The Ultimate Guide to Building Your Own Free Social Media App