

WooCommerce’s built-in reports cover the basics, sales totals, top products, a bit of customer data. Once you need to know actual profit margins, funnel drop-off, or cohort behavior, you’re looking at a dedicated reporting tool. The five below split into two groups: plugins that live inside WooCommerce, and standalone analytics platforms that connect to it.

Why WooCommerce’s Native Reports Fall Short So Quickly
The default Analytics dashboard that ships with WooCommerce is genuinely useful for a first glance, revenue this week versus last week, which product sold the most units, roughly where orders are coming from geographically. What it doesn’t do, and was never really built to do, is answer the harder questions that actually drive decisions: which products are profitable after accounting for cost of goods, where in the checkout funnel customers are dropping off before completing a purchase, whether a given marketing campaign brought in customers who stuck around or one-time buyers who never returned. Those questions require either cost data the native reports don’t track at all, or behavioral tracking across sessions that WooCommerce’s order-centric database schema wasn’t designed around. Once a store owner starts asking “why,” rather than just “how much,” the native dashboard runs out of road fast.
1. YITH Cost of Goods for WooCommerce
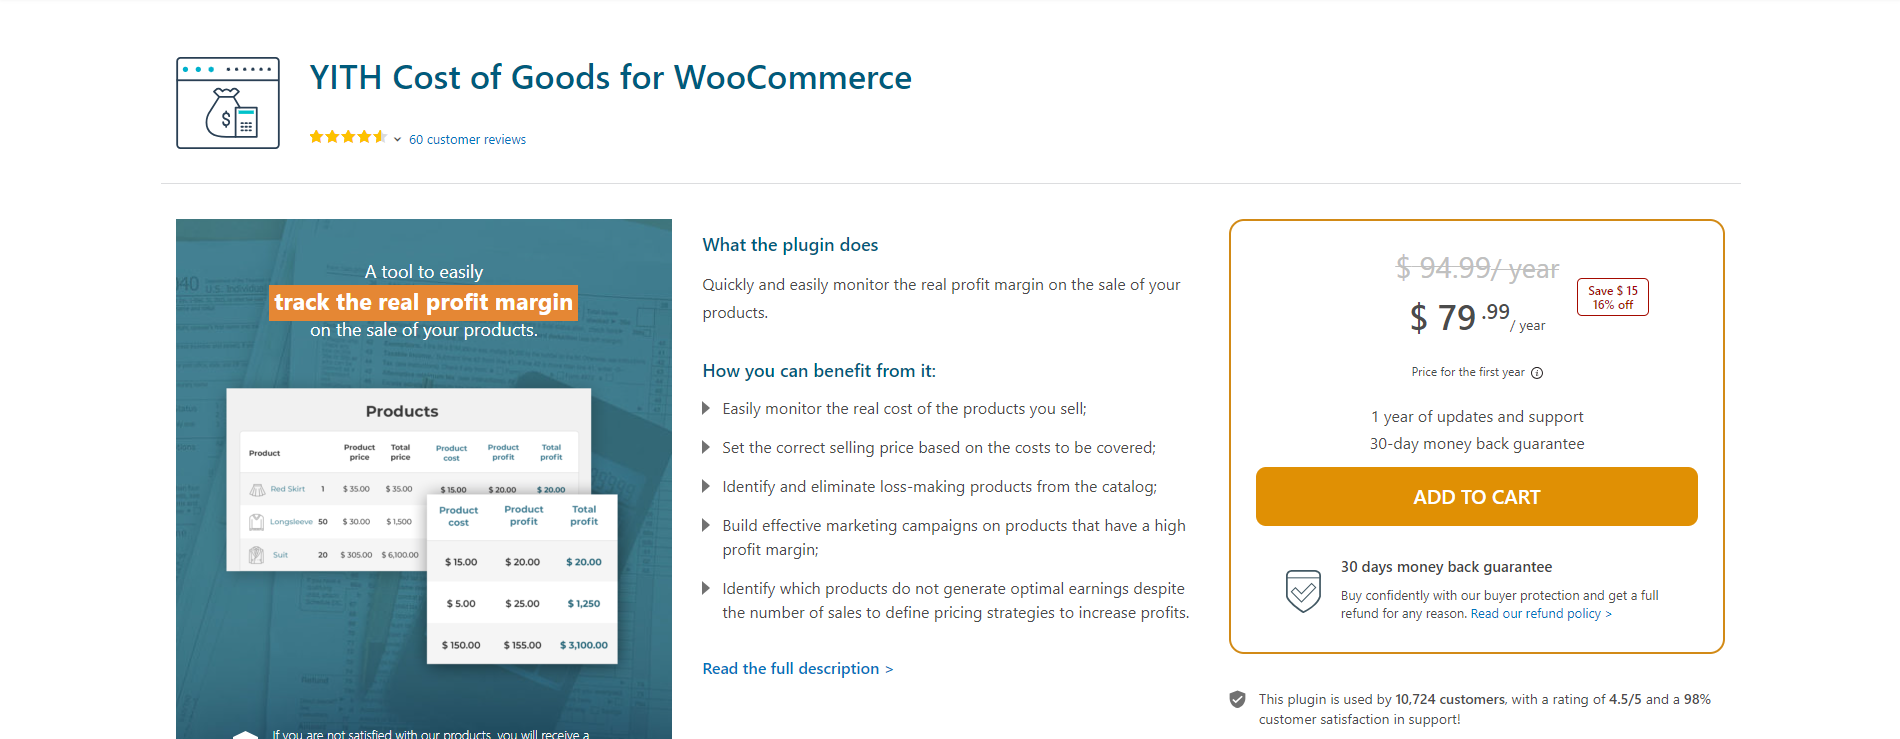
Sales reports tell you revenue; this tells you profit. It tracks actual product cost against sale price so you can see real margins per item, not just what sold well, a product moving a lot of units at a thin margin can lose to a slower seller with a healthy one, and this is the plugin that surfaces that difference.
Cost: Free core version on WordPress.org; Pro around $79.99 first year (renews around $94.99), v2.25.0.
2. Putler

A standalone analytics platform rather than a plugin, you connect it to WooCommerce via a connector plugin, and it handles reporting across multiple sales channels at once if you sell in more than one place. Confirmed still active and sold; check putler.com directly for current tier pricing, since we couldn’t independently re-verify the exact numbers this round.
3. Metorik (replacing Firebase Analytics for WooCommerce)
The previous entry here, Firebase Analytics for WooCommerce, was retired by its vendor (Woo has formally marked the product page “Retired Product”) and is no longer available. Metorik is a genuine WooCommerce-specific replacement rather than a generic swap, real-time analytics, cost and profit reporting, customer segmentation, and automated reports built specifically around WooCommerce (and Shopify) data. 10,000+ stores use it.
Cost: Starts around $20/month, 30-day free trial.
4. MonsterInsights
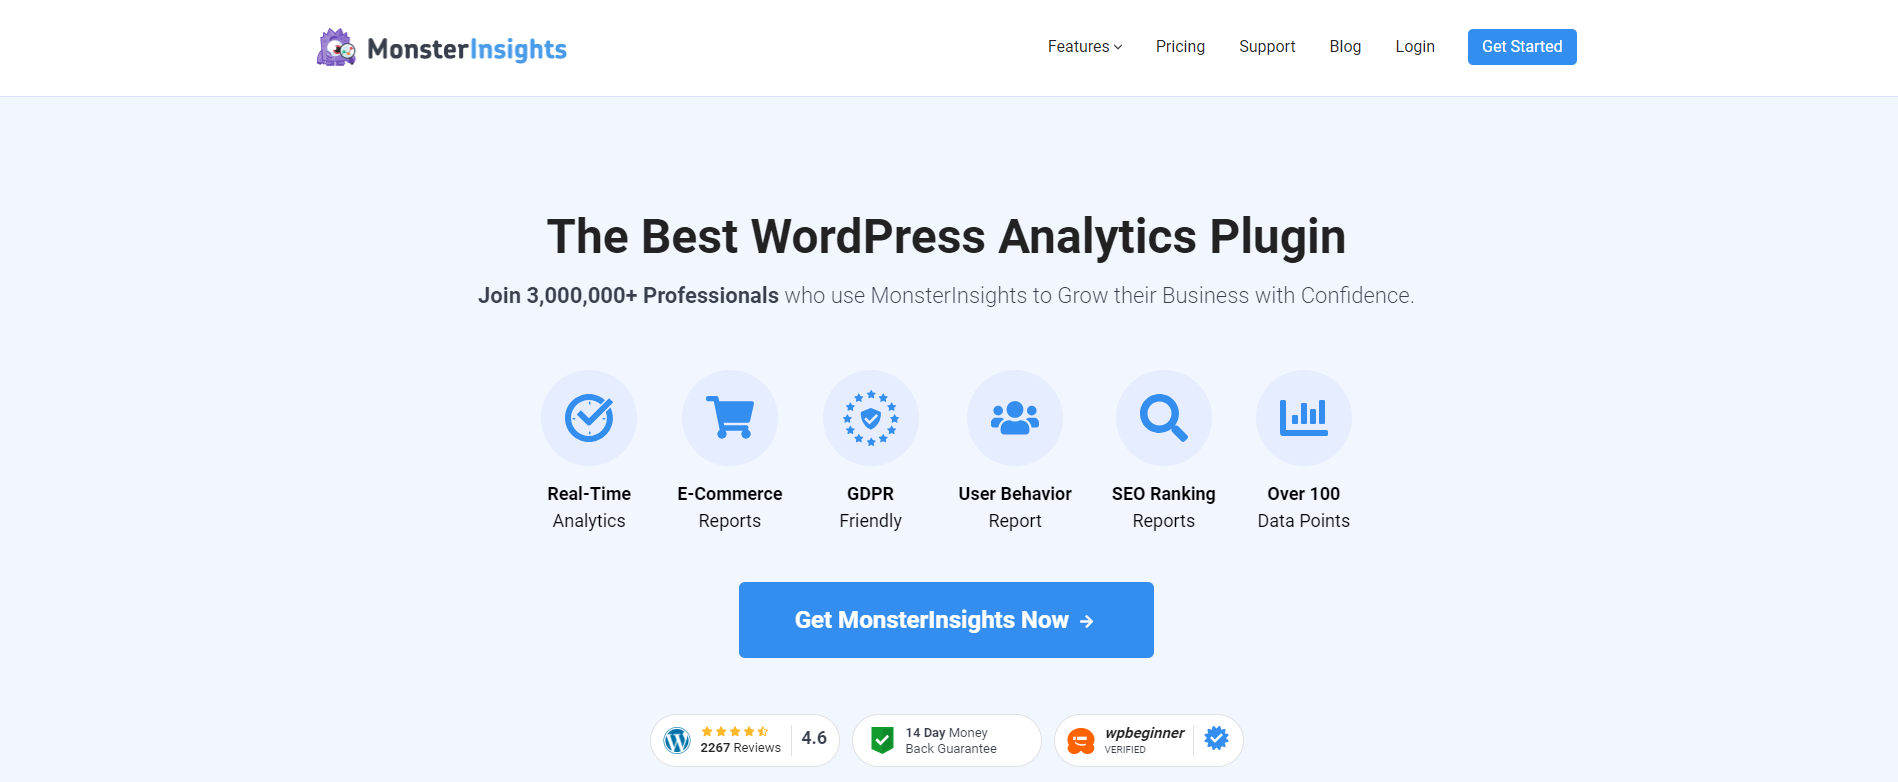
Not WooCommerce-specific, it’s a Google Analytics plugin for WordPress broadly, used on 3 million+ sites, but its eCommerce addon covers WooCommerce reporting well enough that it’s worth including if you’d rather have one analytics tool across your whole site instead of a WooCommerce-only one.
Cost: $49.50/year (Starter, 1 site) up to $399.50/year (Agency, 25 sites), introductory pricing.
5. Metrilo
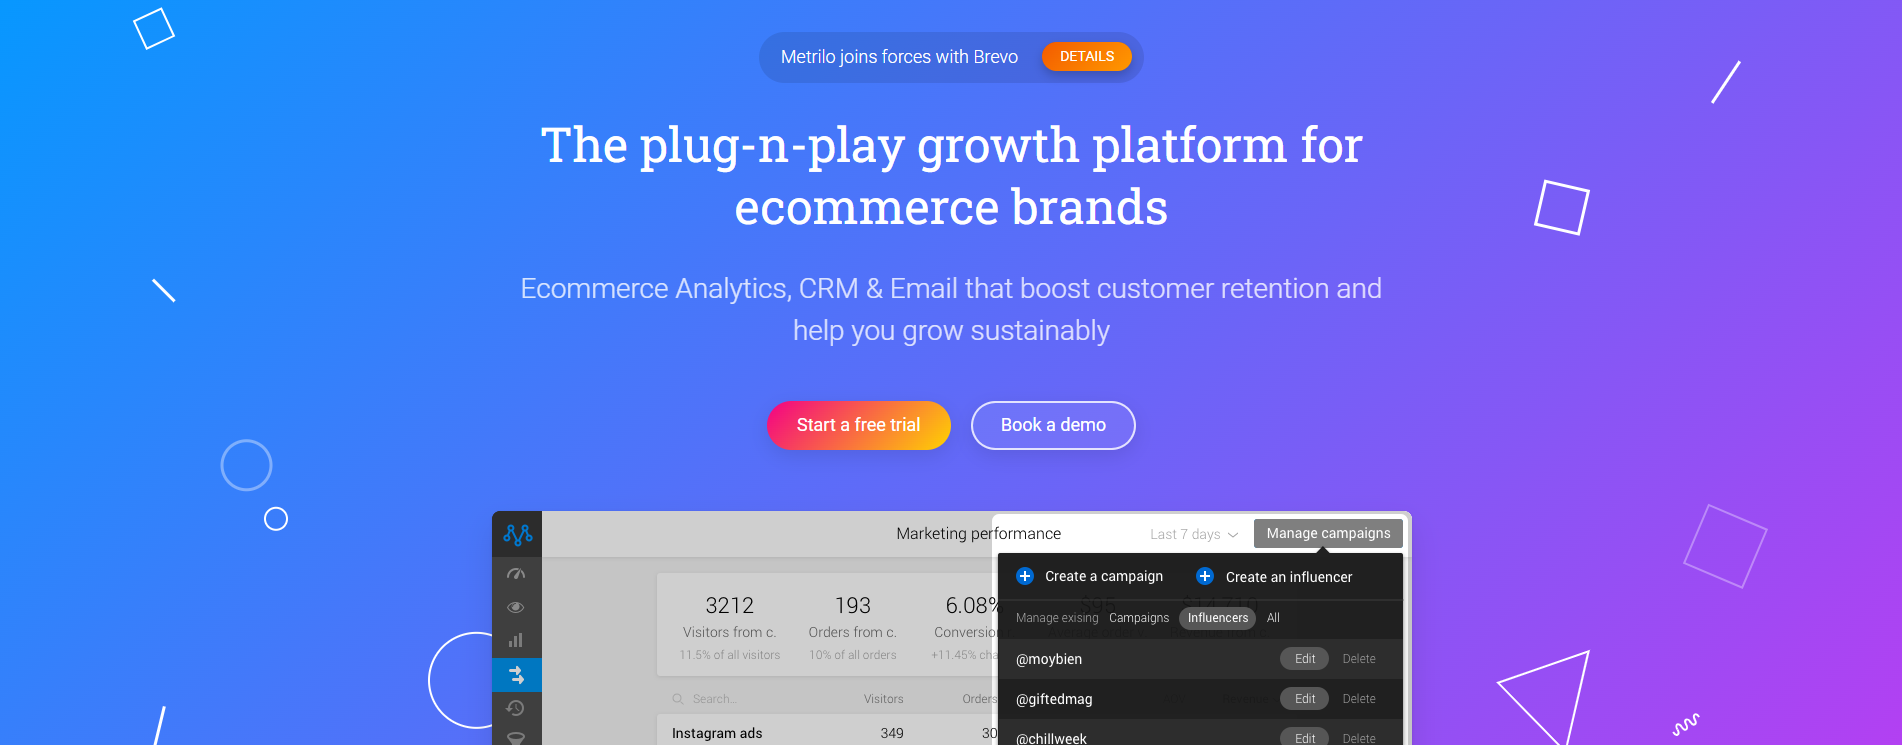
The standout here is funnel analysis, shopping cart, product, and content-marketing funnels tracked separately, so you can see exactly where a customer journey breaks down rather than just knowing the end conversion rate. A cloud dashboard connects via a WooCommerce integration plugin.
Cost: Essential from $165/month (billed annually) up to Premium from $499/month, a significant jump from what this plugin cost when this post was first written.
Comparing the Five at a Glance
| Tool | Type | Starting Cost | Best For |
|---|---|---|---|
| YITH Cost of Goods | WooCommerce plugin | Free / $79.99/yr Pro | Per-product profit margin, not just revenue |
| Putler | Standalone platform | Check current pricing | Multi-channel stores |
| Metorik | Standalone platform | ~$20/mo | WooCommerce-native real-time analytics |
| MonsterInsights | WordPress-wide plugin | $49.50/yr | One tool covering site + store analytics |
| Metrilo | Standalone platform | $165/mo | Deep funnel and cohort analysis |
What “Profit Reporting” Actually Requires You to Set Up First
A cost-of-goods plugin like YITH’s is only as accurate as the cost data you actually enter, and this is the step store owners underestimate most when adopting one of these tools. Every product in your catalog needs an accurate landed cost entered, purchase price plus shipping, customs, and any per-unit overhead you want reflected, before margin reports mean anything real. Skip this step, or enter rough estimates instead of real numbers, and the resulting “profit” figures look precise while actually being closer to a guess dressed up in a chart. Budget genuine time for this setup phase on a catalog of any real size, cost data entry for a few dozen SKUs is a modest afternoon; for a few thousand, it’s a project that needs a spreadsheet import workflow rather than manual entry product by product.
Plugin-Based vs. Standalone Platforms: The Real Tradeoff
The five tools here split cleanly into two categories, and understanding which category fits your situation matters more than comparing individual feature lists. A plugin like YITH Cost of Goods lives entirely inside your WordPress admin, no external account, no data leaving your server, and a one-time or modest annual cost. A standalone platform like Metorik, Putler, or Metrilo runs on its own infrastructure, pulling your order data via API into a separate dashboard, which typically means richer visualizations and more sophisticated analysis (funnel tracking, cohort retention, multi-channel aggregation) but also a recurring subscription that scales with usage and a genuine dependency on a third-party service staying operational and reasonably priced. Neither approach is objectively better, a small single-channel store rarely needs Metrilo’s cohort analysis and would be paying for capability it never uses, while a store running WooCommerce alongside a Shopify storefront genuinely needs the multi-channel aggregation a plugin confined to one WooCommerce install simply can’t provide.
Reading Reports Without Fooling Yourself
A few habits worth adopting regardless of which tool you land on, since a reporting tool only helps if the person reading it interprets the numbers correctly. Revenue and profit are not the same metric, and a dashboard that leads with revenue as the headline number (most do, since it’s the bigger, more flattering figure) can quietly mislead a store owner into treating a top-line sales increase as unambiguously good news even when margin compressed at the same time. Compare like periods, month-over-month during a highly seasonal sales cycle tells you less than year-over-year for the same month, since a July slump compared against a June peak looks alarming even in a perfectly healthy, normally seasonal business. And be skeptical of any single metric in isolation, a spike in traffic without a corresponding spike in conversion rate might mean a bot crawl or a broken tracking pixel just as easily as a genuine marketing win, worth cross-checking against a second data source before acting on it.
Data Accuracy: Where These Tools Can Quietly Drift From Reality
Analytics tools built on top of WooCommerce inherit a specific set of accuracy risks worth knowing about before trusting a dashboard number without question. Refunds and partial refunds need to flow back into profit calculations correctly, a plugin that counts the original sale but doesn’t properly net out a later refund will overstate both revenue and profit for that period. Subscription and recurring-billing orders can be double-counted or miscounted by a reporting tool that wasn’t built with WooCommerce Subscriptions specifically in mind, worth testing a renewal cycle directly rather than assuming compatibility. And any tool relying on client-side tracking pixels for behavioral or funnel data (as opposed to pulling directly from WooCommerce’s own order database) is subject to the same ad-blocker and privacy-browser undercounting that affects standard web analytics broadly, meaning funnel and traffic numbers from these tools should generally be read as directionally useful rather than perfectly precise.
Deciding What to Actually Track: A Short List of KPIs That Matter
Every one of these tools will happily surface dozens of metrics, and the temptation is to build a dashboard that tracks everything available rather than the handful of numbers that genuinely drive decisions for your specific store. A shorter, more disciplined list tends to serve store owners better than a wall of charts nobody actually checks regularly:
- Gross margin by product category, not just overall store margin, since a healthy blended average can hide a category quietly losing money that’s being propped up by a strong performer elsewhere in the catalog.
- Customer acquisition cost against average order value, if you’re running any paid marketing at all, since a growing top-line revenue number funded by spend that exceeds what customers are actually worth is growth you’re paying to lose money on.
- Repeat purchase rate, which tells you far more about the long-term health of the business than a single month’s revenue figure, a store with a strong repeat rate is building something durable even during a slow month, while one entirely dependent on constant new-customer acquisition is more fragile than the top-line numbers alone would suggest.
- Cart abandonment rate at the specific checkout step where it happens, rather than just an overall abandonment percentage, since knowing customers are dropping off specifically at the shipping-cost reveal versus at payment entry points to two completely different fixes.
Picking three or four numbers like these to actually review on a consistent schedule, weekly or monthly depending on your order volume, beats building an elaborate dashboard covering everything a tool can measure and then never actually looking at most of it.
Reporting Cadence: How Often to Actually Check
Checking granular sales data daily is a habit worth resisting for most stores below a certain order volume, since day-to-day noise (a slow Tuesday, a random traffic spike from an unrelated mention somewhere) can trigger reactive decisions that a calmer weekly or monthly view would show as normal variation rather than a real signal. Reserve daily checking for operational needs, fulfillment queues, stock levels on fast-moving items, rather than strategic decisions about pricing, marketing spend, or product mix. Those bigger calls are better made against a weekly or monthly view where short-term noise has had a chance to average out, and where you’re comparing a genuinely meaningful time window rather than reacting to a single unusually good or bad day.
Combining Sales Reporting With Inventory Data
None of the five tools above are inventory management systems first, but sales velocity data from any of them becomes significantly more useful once it’s read alongside current stock levels rather than in isolation. A product showing strong sales velocity in a reporting dashboard is a reorder signal if stock is running low, and a genuinely urgent one if lead time on restocking that specific supplier is long. Conversely, a slow-moving product sitting on a lot of committed inventory capital is a much stronger candidate for a clearance push than a slow seller with minimal stock tied up in it. If your reporting tool doesn’t natively surface stock alongside sales velocity, a manual cross-check against your WooCommerce inventory screen on a regular cadence closes that gap cheaply enough that skipping it is rarely worth the risk of a stockout on your actual best sellers.
Common Reporting Mistakes Worth Avoiding
Setting up cost-of-goods tracking once and never updating it. Supplier costs change, shipping rates fluctuate, and a cost figure entered eighteen months ago and never revisited quietly drifts away from your actual current margin, sometimes by enough to meaningfully mislead a pricing decision. Treat cost data as something to review at least a couple of times a year, not a one-time setup task.
Comparing revenue across periods with different promotional activity. A month that included a sitewide sale event will always outperform a month without one on raw revenue, that’s not a meaningful trend, it’s the expected effect of the promotion. Segment promotional periods out, or at least flag them clearly, before drawing conclusions from a period-over-period comparison.
Trusting a single tool’s numbers without ever cross-checking. Different tools calculate metrics like “conversion rate” or “customer lifetime value” using slightly different formulas and attribution windows, so seeing a materially different number in two different dashboards doesn’t necessarily mean one is broken, it might just mean they’re measuring slightly different things. Understand each tool’s specific methodology before treating a discrepancy as an error.
Which one to use
If profit margin per product is the gap in your reporting, YITH Cost of Goods solves that specifically and cheaply. For anything broader, it’s really a choice between staying inside WordPress with MonsterInsights or moving to a dedicated platform (Metorik, Putler, or Metrilo), the dedicated platforms cost more but go deeper, particularly Metrilo’s funnel breakdowns and Metorik’s WooCommerce-native reporting.
Frequently Asked Questions
Can I run more than one of these tools at the same time?
Yes, and it’s fairly common to pair a lightweight in-admin plugin like YITH Cost of Goods for margin tracking alongside a broader analytics tool like MonsterInsights for traffic and behavior. Running two standalone platforms simultaneously is less common and rarely worth the doubled cost, since their feature sets overlap significantly.
Will any of these slow down my store’s checkout or admin performance?
In-admin plugins add modest database queries and generally don’t touch the customer-facing checkout flow at all. Standalone platforms pull data via API on a schedule rather than in real time on every page load, so they shouldn’t meaningfully affect frontend performance either, though it’s worth confirming your specific hosting can handle the periodic API sync load if your catalog and order volume are both large.
Do I need a developer to set up cost-of-goods tracking?
No, entering a cost field per product is a standard admin-level task in these plugins, no code required. The time cost is in the data entry itself for a large catalog, not in any technical setup.
How far back can these tools report on historical order data?
This varies by tool. In-admin plugins generally have access to your full order history immediately since they’re reading directly from your existing WooCommerce database. Standalone platforms typically need to sync historical data on initial connection, and how far back that sync reaches depends on the specific service and plan tier, worth confirming directly if historical trend analysis matters for your use case.
Is it worth paying for a standalone platform if my store is still small?
Generally not yet. The deeper capabilities these platforms offer, cohort retention, multi-channel aggregation, sophisticated funnel breakdowns, mostly become actionable once you have meaningful order volume to analyze. A newer or smaller store usually gets more value starting with the free native WooCommerce Analytics dashboard plus a cost-of-goods plugin, and graduating to a paid standalone platform once growth actually justifies the deeper analysis.
Can these tools account for shipping and payment processing fees when calculating profit?
Coverage varies by tool. Cost-of-goods plugins primarily track product cost against sale price, and may or may not have a dedicated field for per-order shipping or processor fees, worth checking specifically rather than assuming. Some of the standalone platforms handle this more comprehensively as part of a broader profit calculation, since they’re built around the full order lifecycle rather than just the product-cost layer WooCommerce natively lacks.
What happens to historical reporting data if I switch tools later?
For in-admin plugins, your underlying WooCommerce order data stays intact regardless of which reporting plugin you’re running, since the plugin is reading existing data rather than creating a separate dataset. For standalone platforms, switching means losing access to that platform’s own processed analytics and any custom segments or cohorts you’d built there, though the raw order data in WooCommerce itself remains untouched and available to whatever tool you migrate to next.
Also read
5 Best WooCommerce Instagram Plugins
10 Best WooCommerce Sales Funnel Plugins to Boost Conversions