
A single poll question answers one thing: which option do people prefer. The moment you need to understand why, or you need more than one data point per respondent, a one-question poll stops being enough. Product feedback, NPS-style satisfaction checks, and member research all need a real survey: multiple questions, a logical flow across pages, and a way to get the raw responses out into something you can actually analyze.
WB Polls’ survey engine covers that gap on WordPress: a multi-page survey custom post type, response analytics, GDPR consent fields, and CSV export, running on the same plugin that already handles your BuddyPress activity-feed polls and standalone questions. This guide walks through building one, honestly, including where the free Lite version’s admin screens stop and the paid survey engine picks up.
Table of Contents
- Why a Single Poll Question Isn’t Enough
- What WB Polls’ Survey Engine Actually Includes
- Building a Multi-Page Survey, Step by Step
- Managing Survey Status: Active, Paused, Closed
- The Response Analytics Dashboard
- GDPR Consent and Resubmit Controls
- Exporting Responses to CSV
- Writing Questions People Will Actually Finish
- A Real-World Scenario: A Quarterly Member Satisfaction Survey
- What to Actually Do With the Exported Data
- FAQs
Survey length has a direct, measurable effect on whether people finish: surveys with 1-3 questions average 83% completion, but that drops to 65% for 4-8 questions and falls further to 42% once a survey passes 15 questions, according to Survicate’s 2025 benchmark report. A multi-page structure that lets respondents see progress and stop at a natural break point matters more than almost any other design decision you’ll make.
Why a Single Poll Question Isn’t Enough
A poll is built for one decision: this or that, with a result you can show immediately. A survey is built for understanding: a sequence of questions that, taken together, tell you something a single data point can’t. Member satisfaction, product-market fit, event feedback, and course evaluations all need the second kind of instrument, not the first.
The practical difference shows up in the data structure. A poll stores one vote per visitor. A survey needs to store a full response, every answer tied to the same respondent, so you can see how someone who rated satisfaction low also answered the follow-up question about why. That’s a meaningfully different engine than a poll, even when both live inside the same plugin.
What WB Polls’ Survey Engine Actually Includes
WB Polls runs three engines under one license: BuddyPress activity-feed polls, standalone polls with five answer types (text, image, video, audio, and HTML), and a dedicated survey engine. The survey engine specifically includes a multi-page survey custom post type, active/paused/closed status controls, a response analytics dashboard, GDPR consent fields, resubmit controls, and CSV export, confirmed directly from the product’s own documentation.
One thing worth being precise about: the survey engine is linear, not branching. There’s no conditional logic that skips question 4 based on how someone answered question 2. If your research design genuinely needs branching paths, that’s outside what WB Polls currently does; for the large majority of satisfaction and feedback surveys, a well-ordered linear flow across pages covers the actual need.
Pricing: Personal is $49/year (or $149 lifetime) for one site, Professional is $99/year (or $299 lifetime) for five sites and is the most popular tier, and Agency is $129/year (or $349 lifetime) for unlimited sites. All three tiers include the same features across all three engines, the difference is purely site count. Version 5.0 added an embed snippet for dropping a poll or survey into external platforms like Webflow, Shopify, or Notion, worth knowing if your survey needs to live somewhere besides the WordPress site itself.
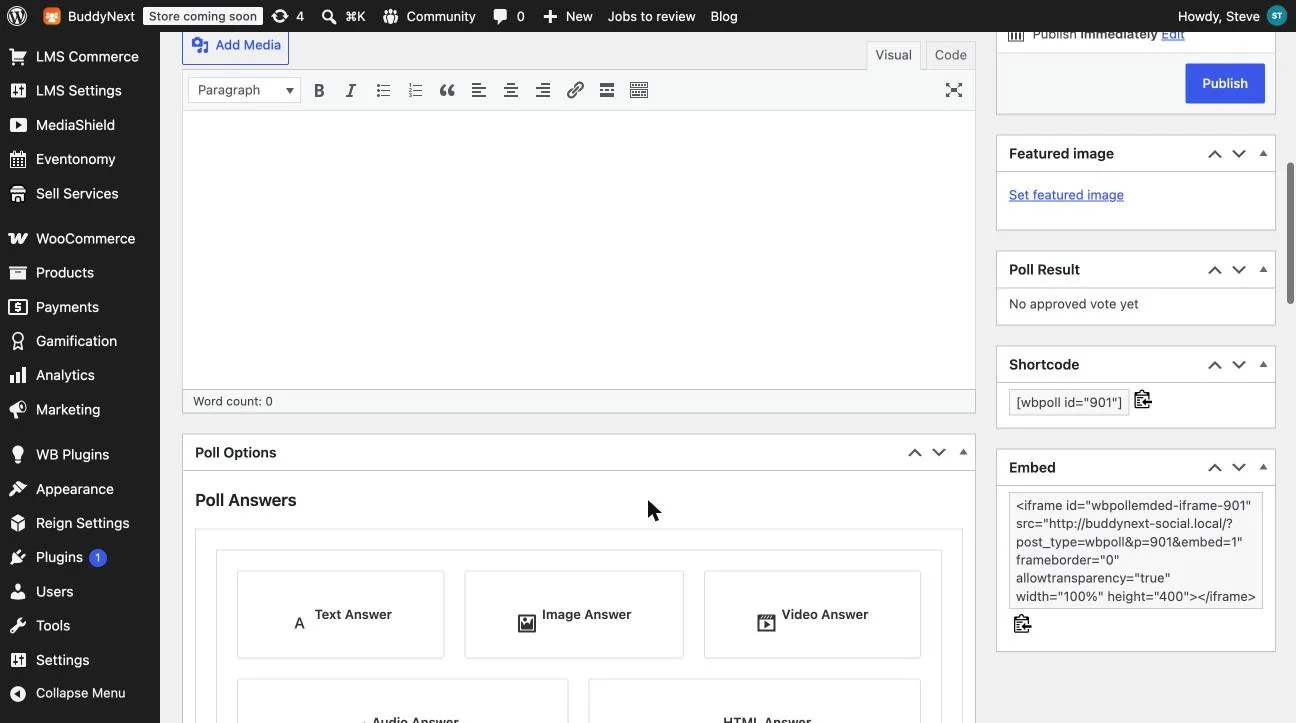
Worth noting honestly: the screenshots in this guide come from WB Polls Lite, the free WordPress.org version, which gives you the poll builder, the five answer types, and the embed/shortcode tooling shown above. The multi-page survey post type, the full analytics dashboard, and CSV export specifically are part of the paid product’s survey engine, confirmed on the official pricing page. If your admin screens don’t show a dedicated survey interface yet, that’s the free-vs-paid boundary, not a setup mistake.
Building a Multi-Page Survey, Step by Step
Start with the end in mind: write down the three to five things you actually need to learn before you open the survey builder. Every question that doesn’t map to one of those goals is a question that costs you completion rate for no real return, and the Survicate data above makes that cost concrete and specific.
- Page 1, quick wins: rating-scale and multiple-choice questions first, since these take seconds and rarely cause abandonment
- Page 2, the real substance: one or two open-ended questions, placed after the respondent has already invested time
- Page 3, segmentation: demographic or tier/role questions last, where a skip costs you the least analytical value if someone drops off
- Every page: short enough to see in full on a phone screen without scrolling to find “next”
A page that requires scrolling to find the “next” button quietly increases abandonment at exactly the point you can’t see it happening.
Use the five answer types deliberately rather than defaulting to text for everything: image and video answers work well for visual preference testing, HTML answers let you embed richer context or branding directly into a question, and audio answers are genuinely useful for voice-of-customer research where the exact wording matters. Preview the full flow yourself on both desktop and mobile before publishing, page by page, since a survey that looks fine on a wide monitor can break badly on a phone screen.
Managing Survey Status: Active, Paused, Closed
The three-status model, active, paused, and closed, solves a real operational problem: you often want to stop collecting new responses without deleting the survey or losing the data you’ve already gathered. Pausing is the right move when you need to review early responses before deciding whether to keep running, or when you’ve hit your target sample size and want to double-check results before fully closing.
Closing a survey should be a deliberate step, not something that happens by accident when you forget it’s running. Set a calendar reminder tied to your actual collection window (two weeks is a reasonable default for most feedback surveys) so you close on schedule rather than discovering three months later that a survey has been quietly collecting responses no one is looking at.
The Response Analytics Dashboard
The analytics dashboard is where you get a first read on results without exporting anything: response counts, completion rates per page (useful for spotting exactly where people are dropping off), and basic breakdowns for multiple-choice questions. This first-pass view is usually enough to catch an obvious problem, a confusing question, a technical glitch on one page, before you’ve committed to a full export-and-analyze cycle.

GDPR Consent and Resubmit Controls
If you’re collecting anything that could identify a respondent, even just an email address for follow-up, the built-in GDPR consent fields matter, not as a checkbox exercise but as the actual legal basis for storing that data if you have EU respondents. Configure the consent language to specifically describe what you’re collecting and why, rather than using generic placeholder text, since a consent notice that doesn’t match what you’re actually doing with the data isn’t real consent.
Resubmit controls decide whether the same person can answer your survey more than once. For most feedback and satisfaction surveys, you want this locked down, since duplicate submissions from the same respondent skew your results without adding real signal. The exception is a tracking survey you intentionally want someone to retake periodically (a monthly pulse-check, for instance), where allowing resubmission is the correct choice, not a loophole.
Exporting Responses to CSV
CSV export turns the dashboard’s first-pass view into something you can actually analyze: pivot tables in a spreadsheet, import into a BI tool, or hand to a data analyst who doesn’t need WordPress access to do real work with your results. Export regularly rather than waiting until a survey closes, both as a backup and so you can start looking at trends while responses are still coming in.
When you open the export, check for the basics before you trust the numbers: are question labels clear enough to understand without the original survey in front of you, are open-ended responses intact and not truncated, and does the respondent count in the CSV match what the dashboard showed. A mismatch usually means a filter or date range is set differently between the two views, not a data-loss bug, but it’s worth catching before you build a report on the wrong number.
| Question count | Average completion rate |
|---|---|
| 1-3 questions | 83.34% |
| 4-8 questions | 65.15% |
| 9-14 questions | 56.28% |
| 15+ questions | 41.94% |
Source: Survicate 2025 Survey Completion Rate Benchmark Report.
Writing Questions People Will Actually Finish
Question wording matters as much as survey length. A rating-scale question (“How satisfied are you with X, 1 to 5”) takes a few seconds to answer and rarely causes abandonment. An open-ended question (“Tell us about your experience”) takes real effort, and the completion-rate data bears that out: surveys opening with a simple multiple-choice question average 89% completion versus 83% for those opening with an open-ended question, and surveys with ten open-ended questions run more than ten points lower in completion than those with just one. Lead with the easy questions, save the one or two open-ended ones for later in the flow, after the respondent has already invested time and is less likely to abandon.
Avoid double-barreled questions that actually ask two things at once (“How would you rate our support speed and friendliness?”) since a respondent who thinks the speed was great but the friendliness was mediocre has no honest way to answer. Split it into two separate questions instead, even if that means one more question on the page, since a clean answer to two questions beats a muddy answer to one. Pilot-test the survey on two or three real people before sending it to your full list; a wording problem that’s invisible to you as the author is often obvious to the first person who actually tries to answer it.
Time abandonment is a separate factor from question-count abandonment: completion rates drop 5-20% once a survey takes longer than 7-8 minutes to finish, regardless of how many questions that represents. A survey with a few long open-ended questions can blow past that time threshold with fewer total questions than a survey built entirely from quick multiple-choice items, so time the actual completion experience yourself rather than assuming question count alone predicts how long it takes.
A Real-World Scenario: A Quarterly Member Satisfaction Survey
Picture a membership site running a quarterly satisfaction survey: five questions across two pages, a mix of rating scales and one open-ended “what would make this better” question, sent to the member list at the start of each quarter. The survey stays active for two weeks, gets paused for a quick sanity check on the first day’s responses, then reopens and runs to close.
Through the quarter, the site owner checks the analytics dashboard weekly for a rough sense of sentiment and page-level drop-off. At close, the full response set exports to CSV, pivoted by membership tier to see whether satisfaction differs between a free tier and a paid tier, and the open-ended responses get read manually for recurring themes that a rating scale alone would never surface. That combination, dashboard for quick signal, CSV for real analysis, is the actual workflow the survey engine is built around, not an either-or choice between the two.
After the second quarter, a pattern shows up that a single quarter’s data couldn’t reveal: satisfaction scores dip specifically among members who joined in the last 30 days, a signal that only becomes visible once there’s a second data point to compare against the first. That’s the real argument for running the same survey on a fixed cadence rather than a one-off: the trend line matters more than any single quarter’s snapshot, and a consistent linear structure (same questions, same page order, same export format) is what makes quarter-over-quarter comparison possible without rebuilding an analysis process from scratch every time.
The site owner adjusts onboarding based on that finding, rechecks the same cohort the following quarter, and confirms the dip narrows. None of that insight comes from the survey tool itself; it comes from treating the export as raw material for an ongoing habit rather than a one-time report, which is the actual differentiator between a membership site that improves over time and one that collects feedback nobody revisits.
What to Actually Do With the Exported Data
An export that sits in a downloads folder unread is wasted effort for both you and every respondent who took the time to answer. Build a short, standing habit around it: within a week of closing a survey, pull the three biggest takeaways (not every finding, the three that actually change a decision) and share them somewhere the team or the members themselves will see them.
Closing the loop with respondents, even a short “here’s what we heard and what we’re changing” post, measurably increases participation in your next survey, since people are more willing to spend time answering questions when they’ve seen a previous round actually lead to something. Treat the export as the start of a decision process, not the finish line of the survey project.
FAQs
1. Can WB Polls surveys branch based on a respondent’s previous answer?
No. The survey engine is linear and multi-page, not branching. Every respondent sees the same question sequence regardless of how they answered earlier questions. For most feedback and satisfaction use cases, a well-ordered linear flow covers the need; if your research design genuinely requires conditional branching, that’s outside WB Polls’ current feature set.
2. Is the multi-page survey engine available in the free version?
The free WB Polls Lite plugin on WordPress.org gives you the core poll builder, five answer types, and embed tooling. The full multi-page survey post type, analytics dashboard, and CSV export are part of the paid product, starting at $49/year for a single site.
3. How many questions should a survey actually have?
Based on the Survicate benchmark data, 1-3 questions get the highest completion rates (83%), with a steady drop as length increases. Keep a survey as short as it can be while still answering the specific question you need answered, and split longer research into separate, shorter surveys rather than one long one.
4. What happens to responses if I pause a survey?
Pausing stops new submissions but keeps all existing response data intact and accessible in the dashboard and export. It’s the right choice when you want to review early results before deciding whether to keep collecting, without losing anything already gathered.
5. Can I require respondents to be logged-in members, or allow anonymous responses?
WB Polls’ broader feature set (confirmed across its poll and survey engines) supports both guest and member-restricted participation depending on configuration; check the specific visibility settings on your survey post to confirm which mode is active before publishing.
6. Does the CSV export include open-ended text answers, or just multiple-choice data?
CSV export is built to capture full response data, which includes open-ended text answers alongside structured multiple-choice selections, since the value of qualitative feedback is usually in the exact wording, not just a count.
7. How is a WB Polls survey different from a standalone WB Poll?
A standalone poll captures one vote per respondent on a single question, shown as an instant result. A survey captures a full multi-question response tied to one respondent across multiple pages, built for analysis rather than an instant visual result.
8. Can I embed a WB Polls survey outside my WordPress site?
Yes, version 5.0 added an embed snippet that works on external platforms like Webflow, Shopify, and Notion, using the same iframe-based embed approach shown for standalone polls.
9. What’s a reasonable length of time to run a survey before closing it?
Two weeks is a common default for feedback and satisfaction surveys, long enough to capture responses across different days and times without letting the survey run so long that early and late respondents are answering under meaningfully different conditions.
10. Does resubmit control apply per device or per logged-in account?
Resubmit restrictions are tied to respondent identity, which for logged-in members means the account itself; check your specific configuration to confirm how guest/anonymous resubmission is handled, since that detail affects how strictly duplicate responses are prevented for non-member visitors.
11. Should I offer an incentive for completing a survey?
An incentive can meaningfully boost response volume, but it’s not a substitute for a well-designed, appropriately short survey; a confusing or overlong survey with an incentive attached still suffers the same completion-rate problems described above, just with more people starting it and abandoning partway through.
12. Can I reuse the same survey structure for multiple separate audiences?
Yes, duplicating a survey post and adjusting distribution (who receives the link, or where it’s embedded) is the standard way to run the same question set across different segments, such as free versus paid members, while keeping each audience’s responses in a separate, exportable dataset.
Summary
A single poll question tells you what people prefer; a real multi-page survey tells you why, and WB Polls’ survey engine gives WordPress site owners that second capability without leaving the platform or paying for a separate SaaS survey tool. Keep surveys short, structure pages around related questions, use the status controls deliberately, and treat the CSV export as the start of a decision process rather than a filing-cabinet exercise, and the data you collect will actually get used.
Before you send the first invitation, build and submit the survey yourself end to end, on both desktop and a real phone, to confirm every page loads cleanly and the final submission actually lands in the response log. A survey with a broken final page costs you every response that reaches it, and that failure mode is invisible from the admin screen until you’ve walked the whole path as a respondent would.